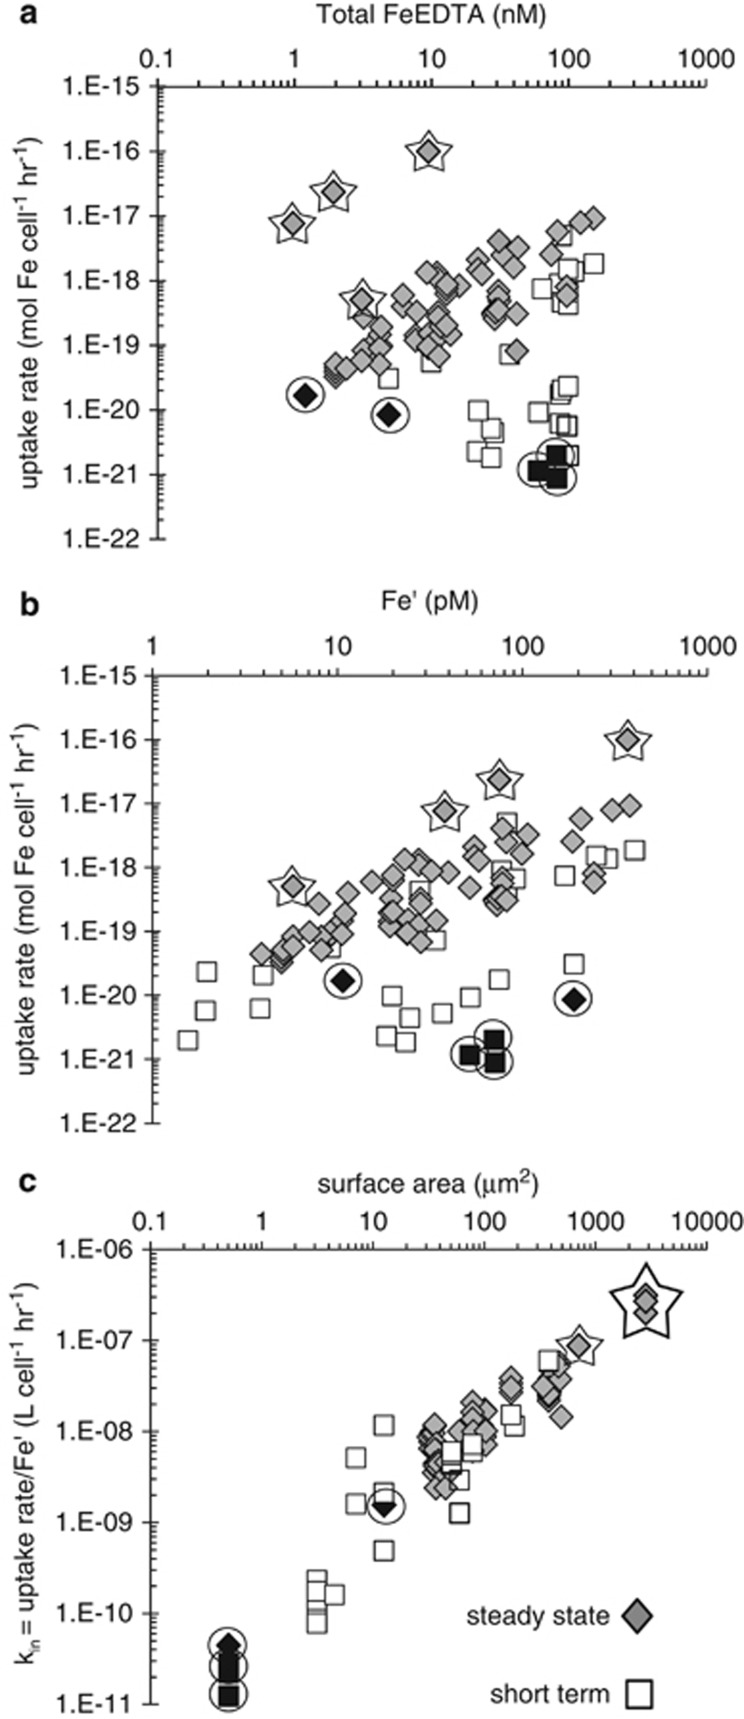
Figure 1.
Fe′ uptake rates of Fe-limited phytoplankton within an FeEDTA system. Each data point represents a single rate measurement derived from either short-term radioisotope (diamonds) or steady-state growth (squares) experiments. To encompass the breadth of Fe concentrations and uptake rates, both x and y axes are in log scale. Data points for the largest cells are outlined by stars, while data points representing the smallest cells are black and outlined by circles. (a) Cellular iron uptake rate (mol Fe per cell h−1) as a function of FeEDTA concentration (nM). (b) Iron uptake rate as a function of unchelated inorganic iron, Fe′ (pM). (c) Uptake rate normalized to Fe′ concentration (l per cell h−1) as a function of cell S.A. (μm2).

