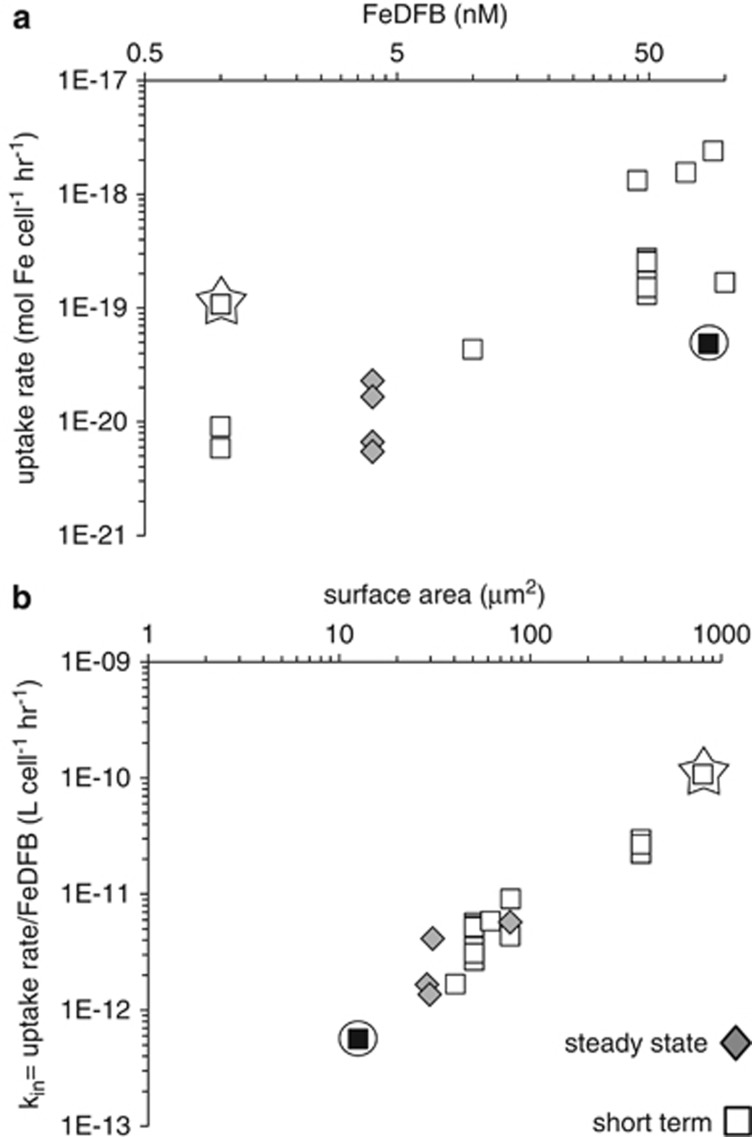
Figure 2.
FeDFB uptake by iron-limited phytoplankton. Each data point represents the result of a single experiment. Short-term and steady-state growth measurements are indicated by diamonds and squares respectively. Data points for the largest cells are outlined by stars, while data points representing the smallest cells are black and outlined by circles. Note that x and y axes are in log scale. (a) Fe uptake rate as a function of FeDFB concentration. Even in the presence of slight excess ligand relative to iron, Fe′ concentrations in this experimental system are negligible and the sole substrate for uptake is FeDFB. (b) Uptake rate normalized to FeDFB (l per cell h−1) as a function of cell S.A. (μm2).

