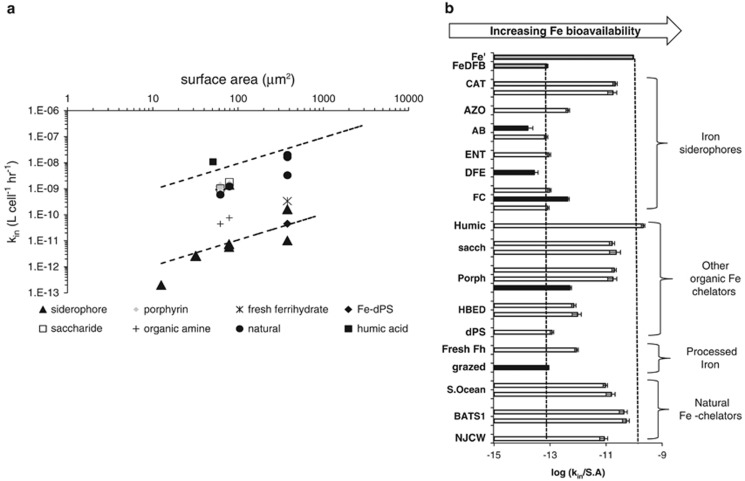
Figure 4.
Comparing Fe substrate bioavailability to iron-limited eukaryotic phytoplankton within the context of a ‘bioavailability envelope'. The envelope's boundaries are delineated by dashed lines, with unchelated inorganic iron (Fe′) as its upper boundary and FeDFB at its lower boundary. (a). Fe substrate bioavailability to different organisms. Each data point is a measurement from a different study. Details regarding organism identity can be found in Supplementary Table S3. Error bars have been omitted for clarity. (b). A bar graph representation of relative bioavailability. Each bar for a given compound represents a different organism. We define substrate bioavailability as the S.A.-normalized uptake rate constant ( ). Black bars represent experiments conducted in the dark, while white bars represent experiments conducted in the light.

