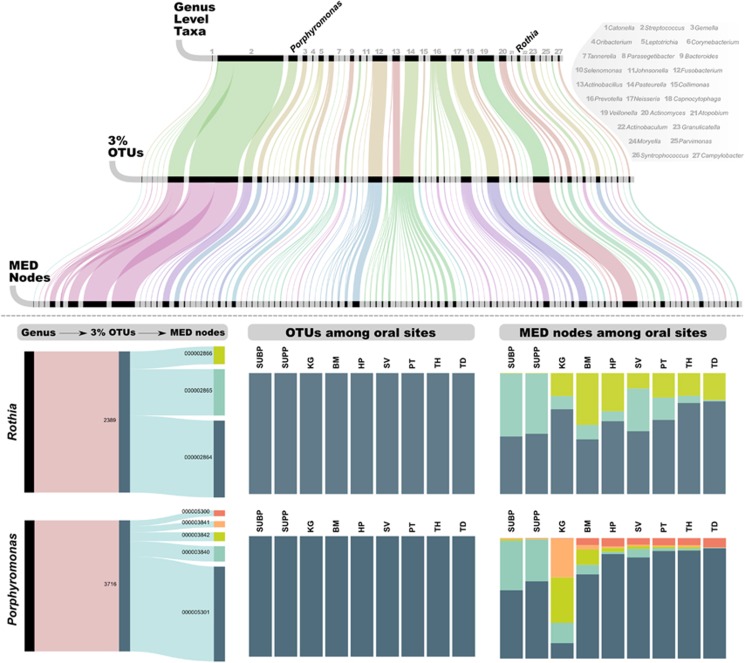
Figure 6.
Alluvial diagram of the relationship between the top 100 MED nodes, OTUs and taxa in the oral microbiome dataset. Three horizontal lines identify the units for a given level. The size of each black bar represents the abundance of that unit in the dataset. The total number of reads represented in each horizontal bar is identical and makes up 83% of the oral microbiome dataset. Vertical lines demonstrate how these reads are grouped differently by each method. The two examples in the bottom panel demonstrate the distribution of OTUs and MED nodes associated with two taxa, Rothia and Porphyromonas across oral sites; subgingival plaque (SUBP), supragingival plaque (SUPP), keratinized gingiva (KG), buccal mucosa (BM), hard palate (HP), saliva (SV), palatine tonsils (PT), throat (TH) and tongue dorsum (TD).

