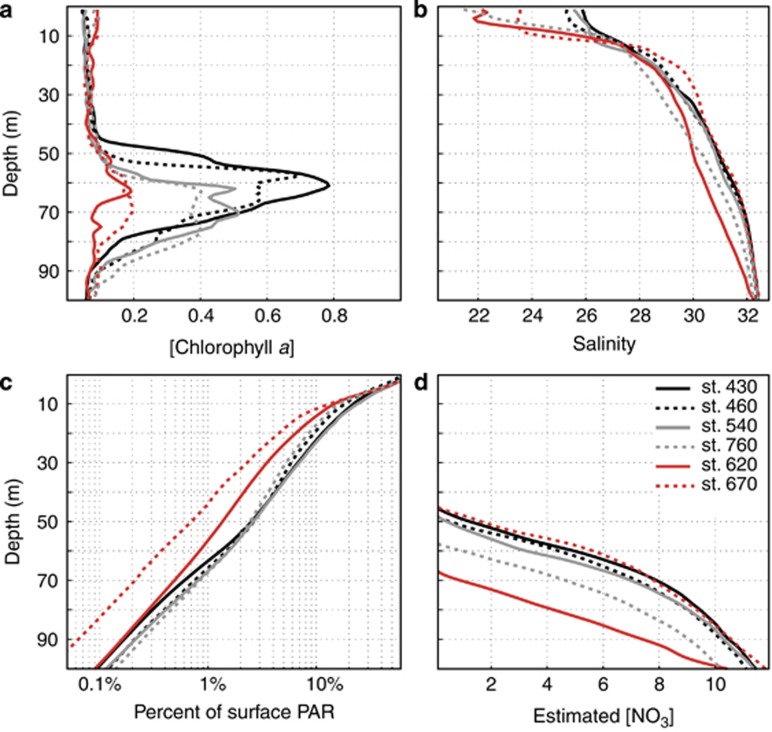
Figure 2.
Profiles from the Beaufort Sea selected stations. (a) Chlorophyll a concentration, from calibrated in situ fluorescence profiles (mg Chl a m−3). (b) Salinity, which is unitless but often referred to as practical salinity units (PSU). (c) Percentage of surface PAR. (d) Nitrate concentration from calibrated in situ profiles (μM). The red lines indicate weak SCM stations; depth indicated on Y axis.

