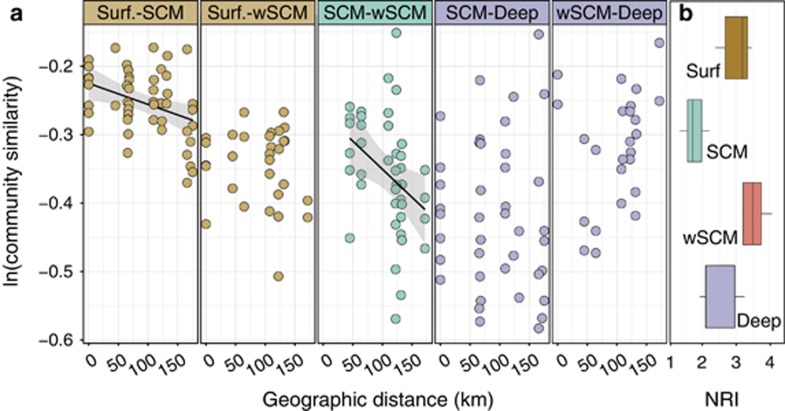
Figure 4.
Community phylogenetic similarities across the selected Beaufort Sea stations. (a) Distance–decay curves for microbial communities from contiguous water masses (Surface vs SCM or wSCM; Deep vs SCM or wSCM) or from the same water mass (SCM vs wSCM). Each dot represents a pairwise comparison of community phylogenetic similarity (expressed as ln(1−dW5000)) and geographic distance between microbial communities. Lines represent best linear fit, with a gray-shaded 95% confidence interval, for which the slope was significantly different than zero (SCM vs Surface: slope=−0.0003 and Bonferroni adjusted P=0.028; SCM vs wSCM: slope=−0.0008 and adjusted P=0.058). (b) NRI (in units of standard deviation) for each community cluster. NRIs were based on standardized mean pairwise distances from community cluster OTU phylogenetic tree. To generate null models to compute NRIs, tips of this phylogenic tree were shuffled to create randomized OTU phylogenetic relationships. An alternative null model yielded similar results (see Materials and methods).

