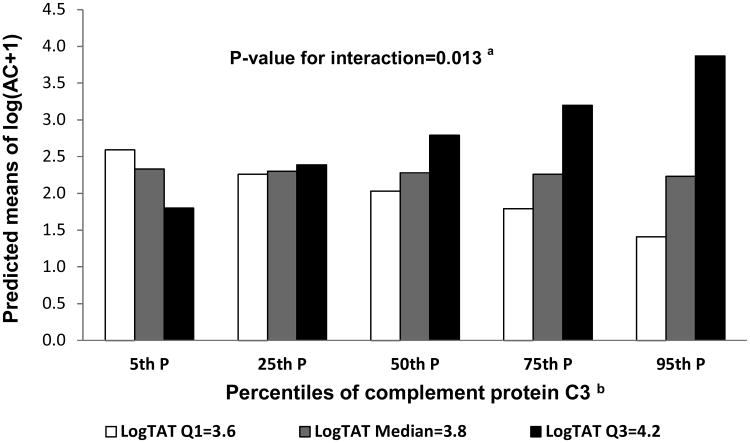
Figure 1.
Predicted values of aortic calcification by C3 percentiles at selected values of log TAT
aInteraction between C3 and log TAT relative to log(AC+1) adjusted for age, race, menopausal status and LDL-C
bC3 percentiles: 5th P=110 mg/dl, 25th P=141 mg/dl, 50th P=162 mg/dl, 75th P=183 mg/dl, 95th P= 218 mg/dl

