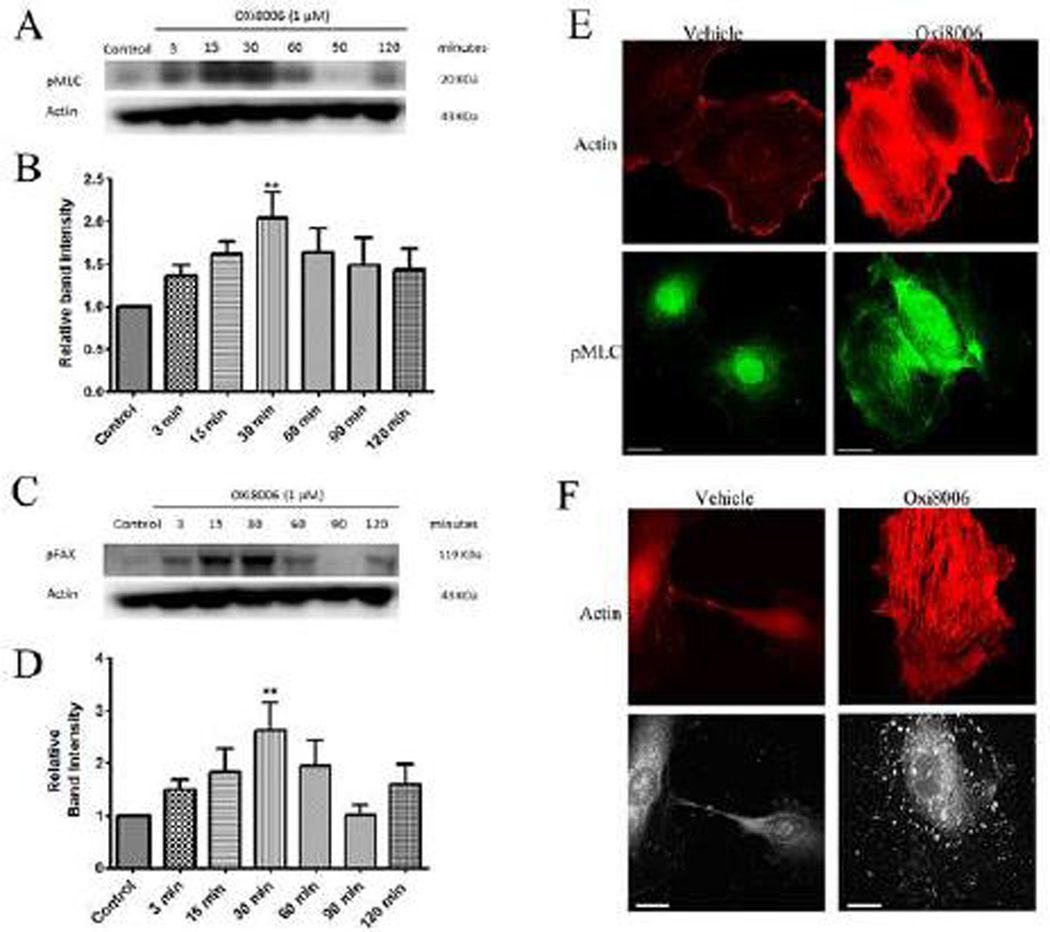
Figure 3.
OXi8006 treatment of activated endothelial cells results in increased MLC and FAK phosphorylation. (A) Treatment (1 µM) initiated increased MLC phosphorylation starting at 3 min, reaching a maximum at 30 min and then slowly decreasing. (B) Quantification of the optical density of the pMLC protein band (18 kDa) normalized to that of the actin band from western blots of OXi8006-treated HUVEC lysates and untreated controls. (C) FAK phosphorylation (pY397) increased starting at 3 min, reaching a maximum at 30 min and then slowly decreasing. (D) Quantification of the optical density of the pFAK protein band (120 kDa) normalized to that of the actin band from western blots of OXi8006 treated HUVEC lysates and untreated controls. Data in bar graphs are presented as mean ± S.E.M. **p < 0.01. (E) Representative confocal images of cells treated with vehicle or 100 nM OXi8006 for 2 h and stained with Texas red conjugated phalloidin (red/actin) and anti-pMLC antibody (green). (F) Representative confocal images of cells treated with vehicle or 100 nM OXi8006 showing increased actin stress fiber accompanied by an increase in FAK phosphorylation (pY397). Focal adhesions and pFAK were localized to each end of actin stress fibers. Cells were fixed and stained with Texas red conjugated phalloidin (red, actin) and anti-FAK pY397 antibody (white, pFAK). (For interpretation of the references to color in this figure legend, the reader is referred to the web version of this article.)

