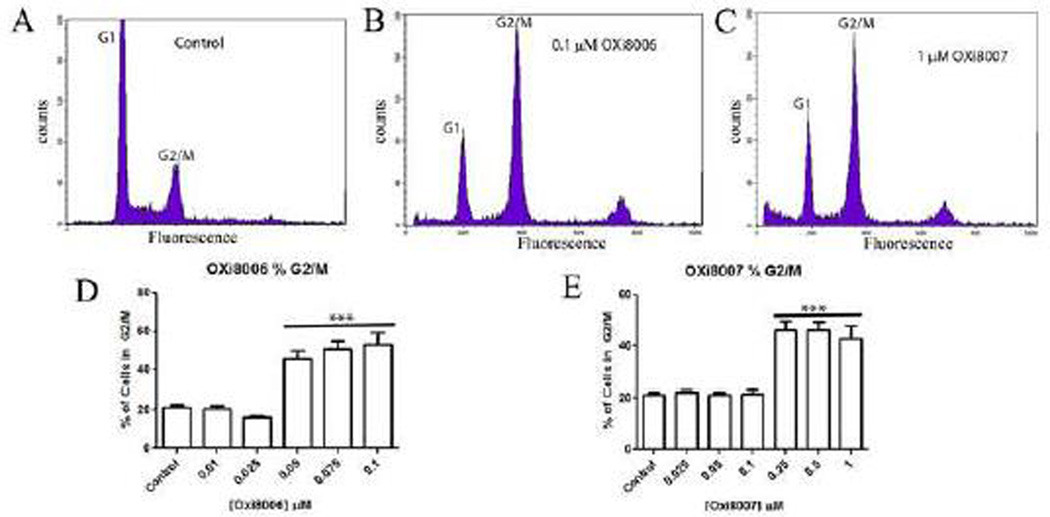
Figure 5.
OXi8006 and OXi8007 induced G2/M arrest in HUVECs. (A–C) Representative DNA histograms and (D, E) bar graphs show concentration dependent increase in the fraction of cells arrested at the G2/M phase upon OXi8006 and OXi8007 treatment. DNA content was assessed by flow cytometry. Data in bar graphs represent three independent experiments and are presented as mean ± S.E.M. ***p < 0.001.

