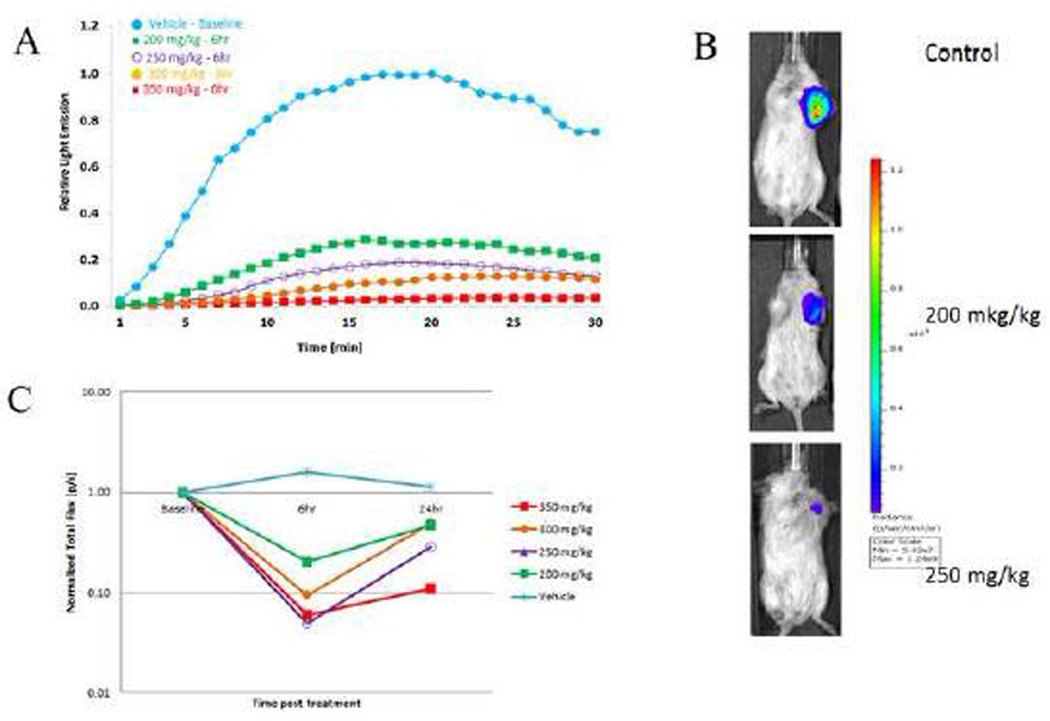
Figure 7.
Dynamic BLI assessment of dose escalation response to OXi8007. Increasing doses of OXi8007 were administered to SCID mice bearing luciferase expressing MDAMB-231-luc human breast cancer xenografts. Dynamic BLI was performed at baseline, and repeated 6 h and 24 h after OXi8007 with fresh luciferin administered SC (120 mg/kg) on each occasion. (A) Representative signal intensity curves for individual tumors showing increase of light emission over 15 minutes following administration of luciferin. Highest signal was seen for control tumor (blue) with lower signals for higher doses of OXi8007 (200 mg/kg green, 250 mg/kg purple, 300 mg/kg orange, 350 mg/kg red). (B) Images for control, 200 and 250 mg/kg showing maximum signal about 17 min after luciferin administration. (C) Normalized mean signal intensity for groups of tumors at each dose observed 17 minutes after luciferin was administered showing dose dependent vascular shutdown (n = 3 tumors per group except 300 mg/kg where n = 2). (For interpretation of the references to color in this figure legend, the reader is referred to the web version of this article.)

