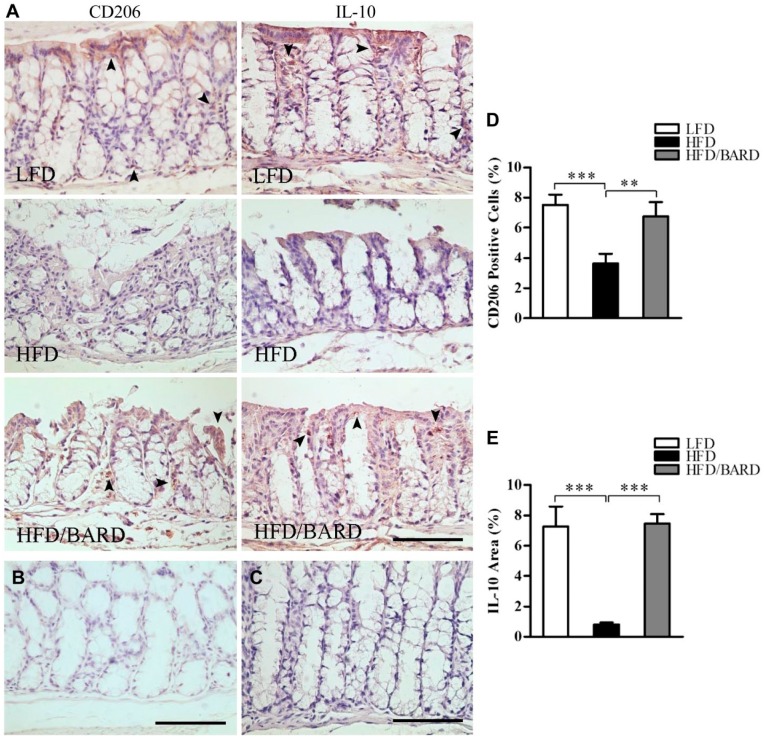
Figure 7.
Effect of bardoxolone methyl (BARD) on the expression of M2 macrophages and anti-inflammatory cytokine IL-10 in colon crypts mice fed a low-fat diet (LFD), a high-fat diet (HFD), and a high-fat diet supplemented with BARD (HFD/BARD). (A) CD206- and IL-10-stained sections (×20). (B) Negative CD206-stained section (×20). (C) Negative IL-10-stained section (×20). The arrowheads indicate CD206-positive cells and IL-10-positive areas (brown). (D) CD206-positive cells (%). (E) IL-10-positive area (%). Six fields per sample (n=7) were used for statistical analysis. All data are presented as mean ± SEM. **p<0.01, ***p<0.001. IL-10: interleukin 10. Scale, 100 µm.

