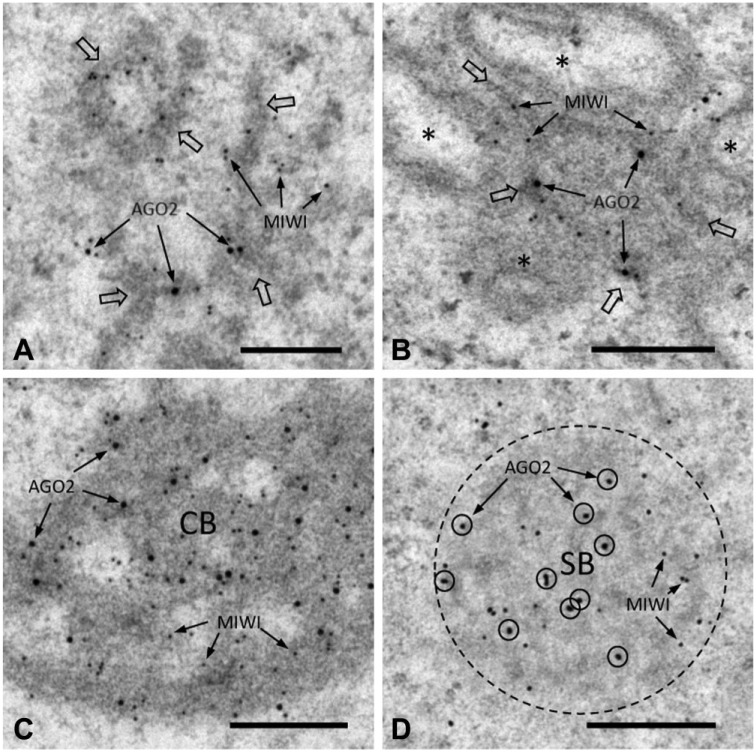
Figure 6.
Dual IEM labeling for AGO2 and MIWI proteins in nuage structures. Large (25-nm diameter) and small (5- or 8.5-nm) gold particles correspond to AGO2 and MIWI proteins, respectively. (A) ISPGs (indicated by large open arrows). AGO2 and MIWI signals are colocalized (arrows) in dense material (ISPGs). (B) IMC (indicated by large open arrows). AGO2 and MIWI signals (arrows) are seen in dense material (IMC) between mitochondria (*). (C) CB. AGO2 and MIWI signals are closely associated with dense material (CB). (D) SB (bordered by dotted line). AGO2 (circled) and MIWI signals are seen in SB. Scale, 0.25 μm.

