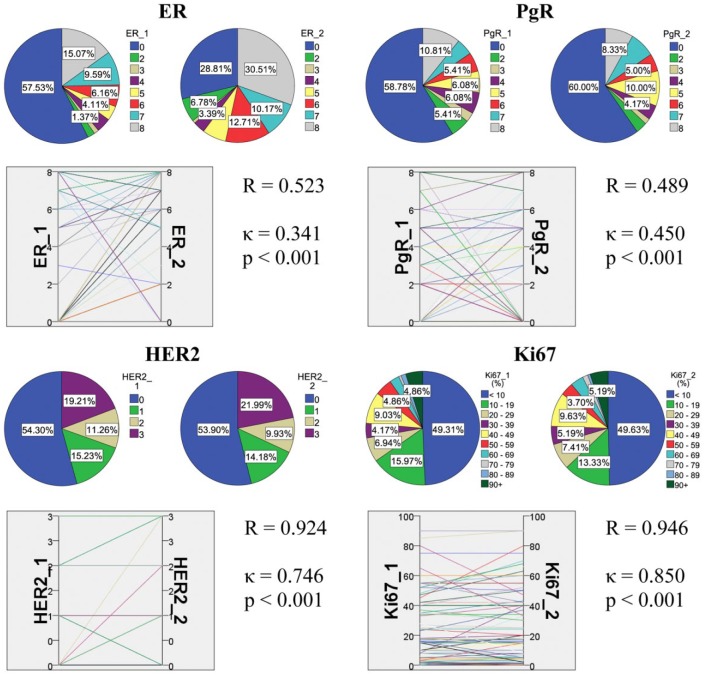
Figure 1.
Summary of the results in all tumor samples regardless of location. The correlation and agreement between ER and PgR Allred scores, HER2 scores and Ki67 labeling index (LI) investigated by repeated immunoprofiling are shown. In each block, pie charts show the distribution of cases according to rounds 1 and 2, and parallel graph displays their relation supported by statistics.

