Figure 1.
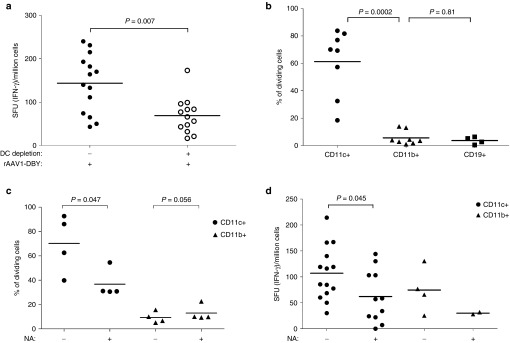
Antigenic presentation and functional contribution of sialic acids on DC for rAAV1 capsid immunogenicity. (a) The role of CD11c+ cells in the anti-capsid CD4+ T-cell response was investigated by injecting the rAAV1-DBY vector (5.109 vg/mice, IM) to mice depleted (+) or not (−) of CD11c+ cells and measuring the IFN-γ response in the spleen after 8 days. Prior to the injection of vector, mice were transplanted with CD11c-DTR bone marrow and CD11c+ cells were depleted in the chimeric animals by three repeated DT injections. Data represent four experiments, each including at least three mice per group. Dots represent individual mouse data and horizontal bars indicate the average value. (b) Antigenic presentation of capsid by different populations of APCs was tested ex vivo following IV injection of the rAAV1-DBY vector to C57BL/6 mice. Purified CD11c+ (circle), CD11b+ (triangle), CD19+ (square) cells were prepared from the spleens of vector-injected mice and were cultured ex vivo with Dby-specific and CFSE-stained CD4+ T cells from Marylin mice at different ratios. The graph represents results obtained with ratios of 1 APC to 105 T cells. Antigenic presentation was evident from the induced CD4 T-cell division measured by FACS as illustrated in Supplementary Figure S1a and results are expressed as % of cells having undergone at least one cell division. Data represent between five and eight experiments. Each dot represents the average antigen presentation value obtained in one experiment on a specific cell type using three mice. Horizontal bars indicate the average value of all experiments per cell type. (c) The functional contribution of sialic acid on in vitro antigenic presentation of the rAAV1 capsid was measured by incubating NA-treated (+) or nontreated (–) CD11c+ (circles) or CD11b+ (triangles) cells with the rAAV1-DBY vector for 1 hour then washing cells and incubating them with Dby-specific and CFSE-stained CD4+ T cells from Marylin mice to measure antigenic presentation by FACS as detailed above. Data are representative of four experiments with four mice per group. (d) The importance of sialic acids on APCs was measured in vivo. CD11c+ (circles) or CD11b+ (triangles) cells that were previously NA-treated (+) or not (−) were incubated with rAAV1-DBY and were injected to C57BL/6 mice (106 cells IV). After 8 days, IFN-γ CD4+ T-cell responses were measured in the spleen by enzyme-linked immunospot assays. Each dot represents one mouse and two to five experiments are shown. Some points had to be discarded due to enzyme-linked immunospot assays signal saturation. Statistical analysis was used to compare the effect of NA on CD11c+ cells in five experiments. FACS, fluorescence activated cell sorting.

