Figure 7.
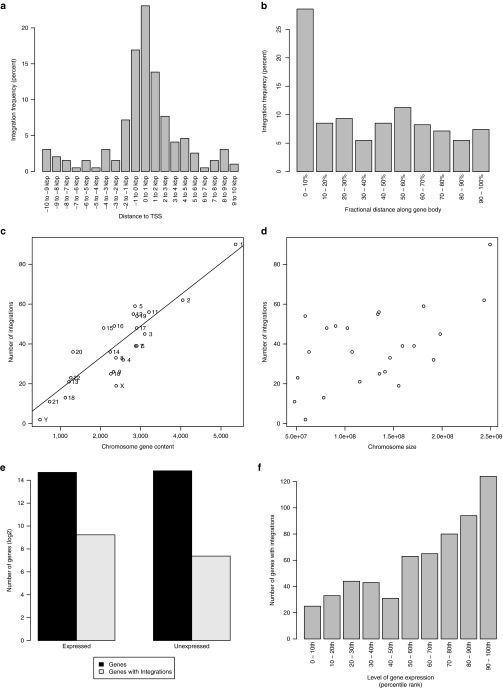
Nonrandom and clustered retroviral integrations. Number of integrations as a function of distance (a) from the transcription start site (TSS) or (b) along the gene body (normalized by length of gene). Number of integrations versus (c) chromosome gene content (i.e., number of genes per chromosome) or (d) chromosome size. Line indicates linear regression fit (r2 = 0.91) excluding sex chromosomes in (c). (e) Total number of genes (in dark gray) that are expressed or unexpressed and number of expressed or unexpressed genes harboring integrations (in light gray). (f) Integrations as a function of gene expression level. Expressed genes (i.e., having fragments per kilobase of transcript per million mapped reads (FPKM) > 0) were sorted based on expression level. They were then divided into 10 percentile bins according to their expression level. Number of integrations for each bin is shown. Expression was determined by the mean of n = 3 FPKM values derived from transcriptome sequencing (RNA-seq) of normal T (i.e., CD3+) cells.

