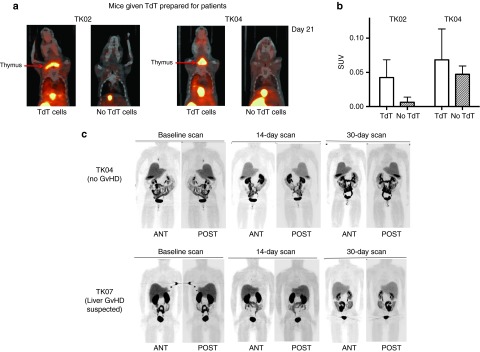
Figure 8.
[18F] FHBG microPET/CT imaging of NSG mice and representative posterior and anterior [18F]FHBG PET/CT scans of patients. A fraction of the transduced cell product provided to patients TK02-TK08 was administered to each of two mice that were subsequently imaged using [18F]FHBG microPET/CT on ~days 7 and 21. NSG mice were injected retro-orbitally with 2 × 10⁶ TdT, then paired with untreated normal control mice. Pairs were simultaneously injected with [18F]FHBG to follow TdT. For each patient product two such pairs (a and b) were imaged 1 hour after injection. (a) Coronal images of pairs infused with cells for TK02 and TK04 21 days earlier. (b) Corresponding standard uptake values in the upper part of the body for the mice shown in a. (c) Patient TK04 experienced no graft-versus-host disease (GvHD), while TK07 had clinical evidence of liver GvHD and was subsequently treated with ganciclovir at week 10. Images shown were acquired 60 minutes after administration of [18F]FHBG. Two whole body PET/CT scans beginning at the base of the brain and scanning through the upper thighs were made of supine patients TK03-TK08 at baseline, ~14 days post-donor lymphocyte infusion (DLI) and ~30 days post-DLI (patients TK04 and TK07 are shown). SUV, standardized uptake value. Error bars represent standard deviation.

