Figure 3.
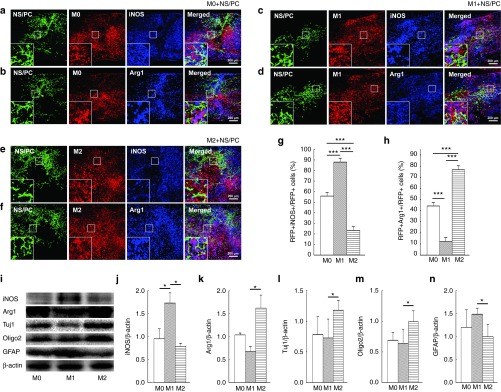
Sustainability of engrafted macrophages in the M0, M1, and M2 polarization states. (a–f) Expression of iNOS (a, c, and e) and Arg1 (b, d, and f) in engrafted neural stem/progenitor cells (NS/PCs) and (a and b) M0, (c and d) M1, and (e and f) M2 macrophages at 3 days after transplantation. The boxed area in each image is enlarged at the lower left-hand corner of the panel. Space bars = 200 μm. (g and h) The percentage of (g) RFP+iNOS+ (h) RFP+Arg1+ cells among the engrafted red fluorescent protein (RFP)-positive macrophages are shown. (i) Western blot analysis of polarized macrophage markers (iNOS and Arg1) and neural lineage markers (Tuj1, Oligo2, and glial fibrillary acidic protein (GFAP)) in tissue dissected from the injured spinal cord containing engrafted NS/PCs and M0, M1, or M2 macrophages. (j and k) Densitometric analysis of iNOS and Arg1 protein expression levels in (i). (l–n) Densitometric analysis of Tuj1, Oligo2, and GFAP protein expression levels. Data in (a–i) are representative of three independent experiments; data in (g–h and j–n) are pooled from three independent experiments (*P < 0.05, ***P < 0.001).

