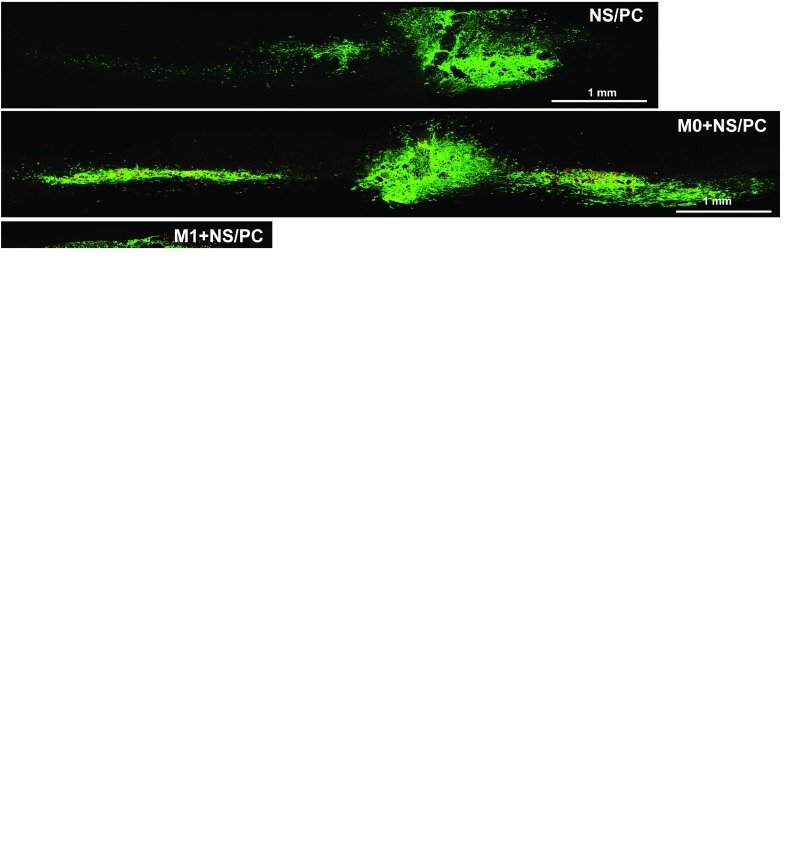
Figure 7.
Migratory patterns of engrafted neural stem/progenitor cell (NS/PC)-derived cells after cotransplantation of AMD3100-treated NS/PCs and macrophages. (a–d) Migration patterns are shown of (a) NS/PCs transplanted alone and (b–d) NS/PCs cotransplanted with (b) M0 macrophages, (c) M1 macrophages and (d) M2 macrophages. In a–d, ** denotes the lesion epicenter. (e) Statistical results showing the integrated optical density (IOD) and the migration distance (P1, P2, P3, and P4) of engrafted NS/PC-derived cells after cotransplantation of AMD3100-treated NS/PCs and macrophages in injured spinal cord. M0+NS/PCs versus M2+NS/PCs, P1 < 0.001; M0+NS/PCs versus M1+NS/PCs, P2 < 0.01; NS/PCs versus M2+NS/PCs, P3 < 0.001; M1+ NS/PCs versus M2+NS/PCs, P4 < 0.001. Space bars = 1 mm.

