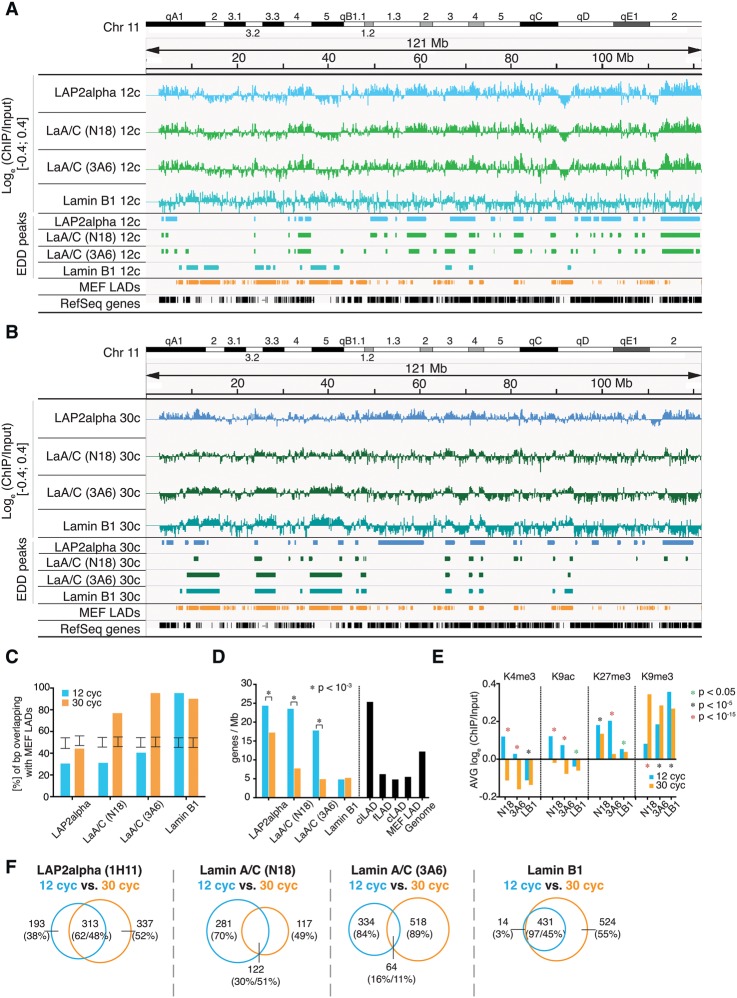
Figure 1.
LAP2alpha and Lamin A/C associate with eu- and heterochromatin. (A,B) Screenshot of Integrative Genomics Viewer (IGV) tracks of Chromosome 11 (mm9) representing loge ratios of ChIP/Input, scale is [−0.4;0.4] (upper panel); peak regions identified by EDD (mid panel); MEF LADs (GSE36132) and the RefSeq gene track (lower panel). Chromatin was sonicated for (A) 12 or (B) 30 cycles. ChIPs were performed with antibodies against LAP2alpha (8C10-1H11) and lamin A/C (3A6-4C11 and N18). (C) MEF LAD overlap. Degree of overlap (% of bp) of EDD peaks with MEF LADs. Error bars indicate the interval that contains 95% of all mean overlaps obtained through random permutation tests. All overlaps are significantly smaller or larger than expected under the null model (P < 10−4). (D) Gene density. Average gene density in EDD/DamID peak regions. Significance of gene density change from 12- to 30-cycle samples was tested using the Wilcoxon rank-sum test. (*) P < 10−3. (E) Histone marks in lamin-interacting sites. Average loge (ChIP/Input) of H3K4me3, H3K9ac, H3K27me3, and H3K9me3 in regions associated with lamin A/C and lamin B1. Differences between distributions of values from 12- to 30-cycle samples were tested by the Wilcoxon rank-sum test; green asterisk signifies P < 0.05, black asterisk P < 10−5, and red asterisk P < 10−15. (F) Extent of overlap between EDD peaks of LAP2alpha, lamin A/C, and lamin B1 after 12 and 30 cycles of sonication; numbers indicate Mb.

