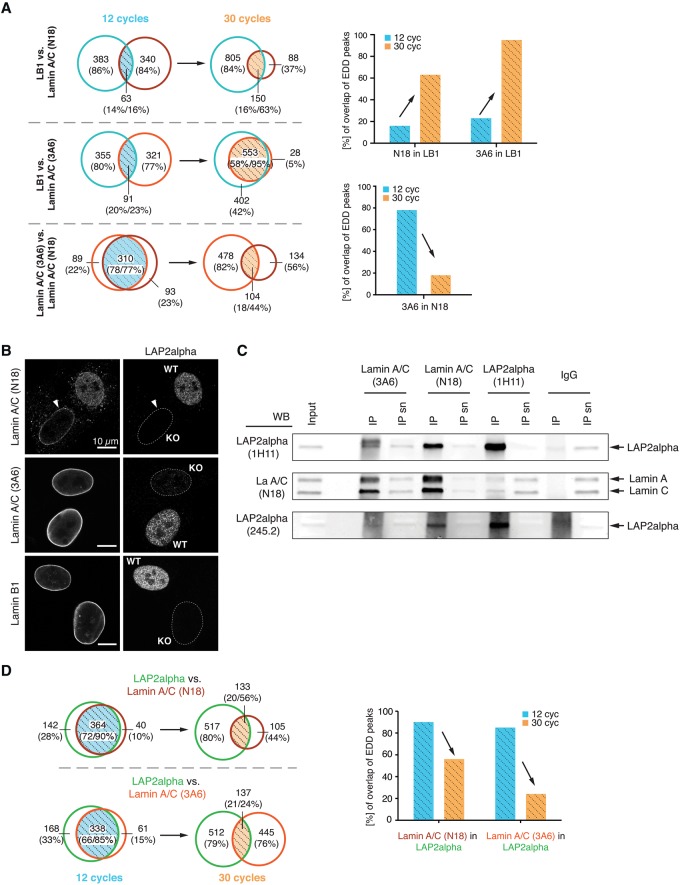
Figure 2.
LAP2alpha and Lamin A/C overlap in euchromatic regions. (A) Venn diagrams of genome-wide overlapping EDD peaks (Mb) of lamin B1 and lamin A/C samples upon 12 and 30 cycles of sonication. Overlaps (hatched) of lamin A/C-3A6 and -N18 with lamin B1 and overlaps of lamin A/C-3A6 with -N18 are highlighted in light blue (12 cycles) and light orange (30 cycles), and the corresponding % of overlap of EDD peaks are depicted as bar graphs. (B) Confocal immunofluorescence microscopic images of a mixed culture of Tmpo WT and KO mouse dermal fibroblasts double-stained for LAP2alpha and lamins as indicated. Unstained nuclei in LAP2alpha panels are outlined by a white dashed line. Scale bar, 10 µm. (C) Co-IPs for lamin A/C-3A6, lamin A/C-N18, and LAP2alpha were performed in Tmpo WT imMDFs. Normal rabbit IgG was used as a negative control. (D) Venn diagrams of genome-wide overlapping EDD peaks (Mb) of LAP2alpha and Lamin A/C samples upon 12 and 30 cycles of sonication. Overlaps (hatched) of LAP2alpha with lamin A/C-3A6 and -N18 are highlighted in light blue (12 cycles) and light orange (30 cycles), and the corresponding % of overlap of EDD peaks are depicted as bar graphs.

