Figure 3.
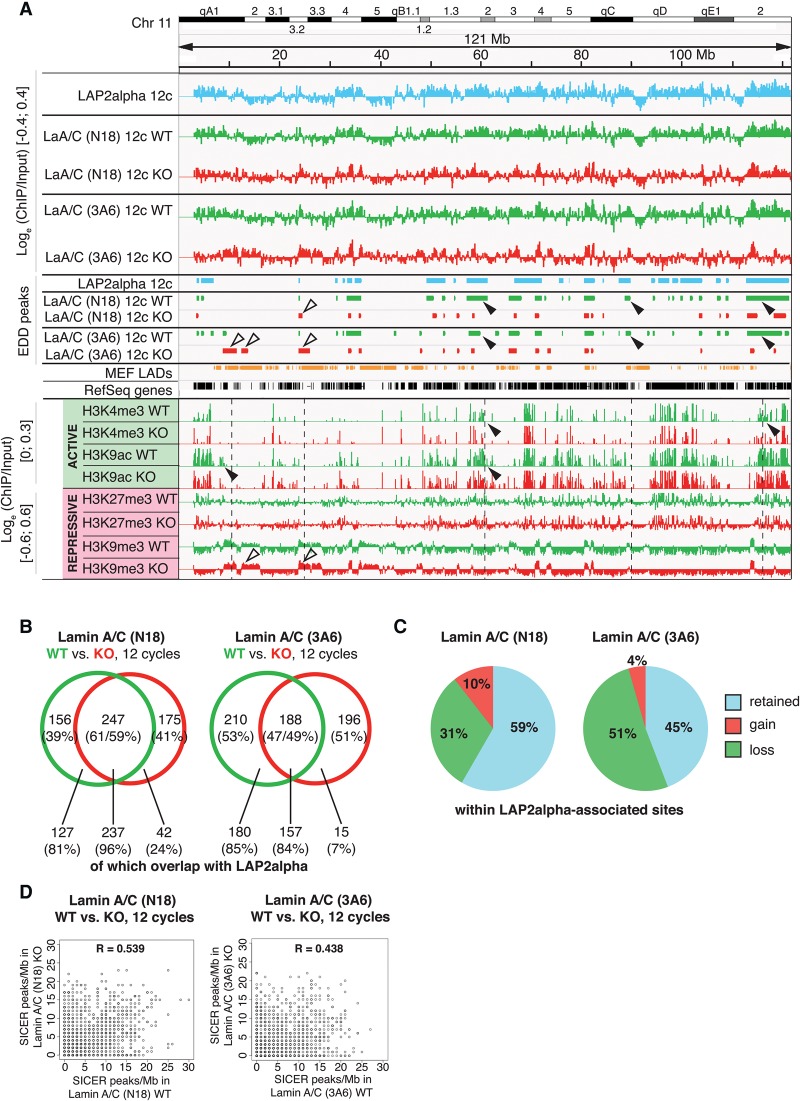
Lamin A/C-chromatin associations are rearranged in LAP2alpha-deficient versus wild-type cells. (A) Screenshots of IGV tracks of Chromosome 11 (mm9) representing loge (ChIP/Input) [−0.4;0.4], peak regions identified by EDD, MEF LADs, the RefSeq gene track, and histone mark tracks. Shown are data for LAP2alpha and lamin A/C (precipitated with 3A6 or N18 antibodies in Tmpo WT and KO cells) after 12 cycles of sonication and data of histone marks after 12 cycles of sonication (scale for active marks H3K4me3 and H3K9ac is loge (ChIP/Input) [0;0.3] and for repressive marks H3K27me3 and H3K9me3 loge (ChIP/Input) [−0.6;0.6]). Black arrowheads point to regions of loss of lamin A/C or histone marks and white arrowheads to regions of gain of lamin A/C or histone marks in Tmpo KO cells. (B) Venn diagrams of EDD peak overlaps [Mb] between lamin A/C in Tmpo WT and KO samples after 12 cycles of sonication. Numbers below Venn diagram show overlap (in Mb and %) of lamin A/C EDD peak fractions (occurring only in WT, in WT and KO, or KO only) with LAP2alpha EDD peaks. (C) Redistribution of lamin A/C within LAP2alpha-associated sites. Pie chart depicting percentage of lamin A/C-associated regions (identified by antibodies N18 or 3A6) within the LAP2alpha-associated regions that retained, lost, or gained lamin A/C binding in Tmpo KO versus WT samples. (D) SICER peak correlations (peaks/Mb) corresponding to data in B.

