Figure 4.
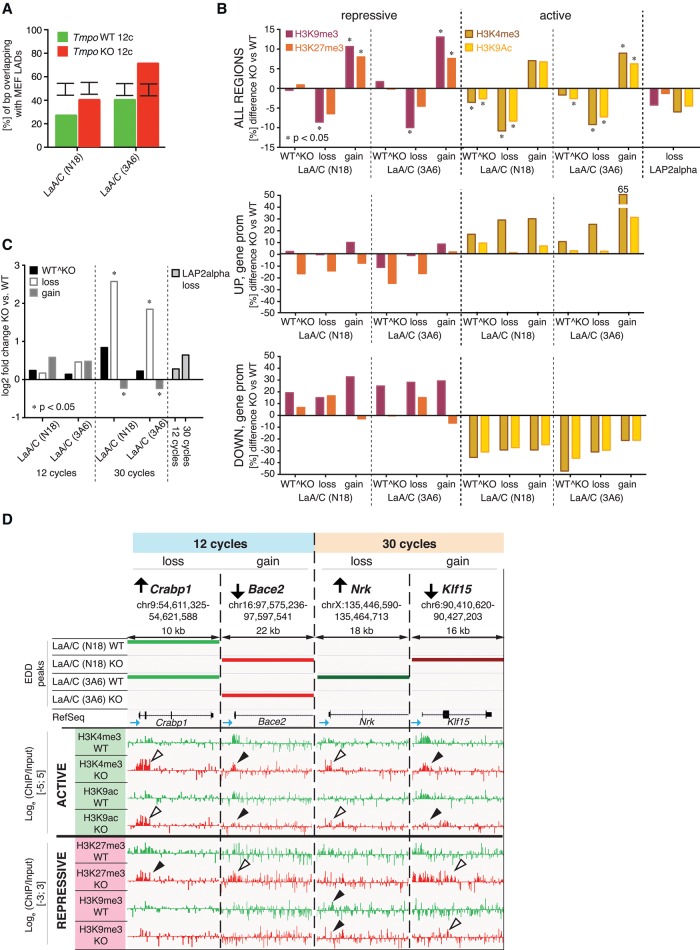
Consequences of lamin A/C redistribution in LAP2alpha-deficient cells on chromatin organization and gene expression. (A) MEF LAD overlap. Degree of overlap (% of bp) of EDD peaks obtained after 12 cycles of sonication for lamin A/C-N18 and -3A6 in Tmpo WT and KO mouse fibroblasts with MEF LADs. Error bars indicate the interval that contains 95% of all mean overlaps obtained through random permutation tests. All overlaps are significantly smaller or larger than expected under the null model (P < 10−4). (B) Change in repressive and active histone marks. EDD peak regions of lamin A/C (N18 and 3A6) in Tmpo WT and KO cells were divided into regions occurring in both samples (“WT^KO”), losing association in Tmpo KO (“loss”), and gaining associations Tmpo KO (“gain”). Percent difference (Tmpo KO vs. WT) in the abundance of repressive (H3K27me3, H3K9me3) and active (H3K4me3, H3K9ac) histone marks present in all lamin A/C-N18 and -3A6 “WT^KO,” “loss,” and “gain” regions, all regions of LAP2alpha loss (ALL REGIONS) and promoter regions of up- (UP, gene promoter) and down-regulated (DOWN, gene promoter) in lamin A/C-N18 and -3A6 “WT^KO,” “loss,” and “gain” regions, after 12 sonication cycles. Asterisk (*) denotes significant change in histone mark abundance (P < 0.05) compared to random permutation testing. (C) Gene expression change. Average log2-fold change of differentially regulated genes in lamin A/C-N18 and -3A6 “WT^KO,” “loss,” and “gain” regions and regions of LAP2alpha loss after 12 and 30 sonication cycles. Asterisk (*) denotes significant gene expression change (P < 0.05) compared to random permutation testing. (D) Redistribution of lamin A/C upon loss of LAP2alpha alters gene expression and histone marks on promoters of affected genes. IGV track compilation of up- and down-regulated genes in regions of loss and gain of lamin A/C in euchromatin-enriched (12 cycle) and heterochromatin-enriched (30 cycle) regions. Shown are EDD peak tracks for lamin A/C-N18 and -3A6 in Tmpo WT and KO cells obtained after 12 and 30 cycles of sonication, followed by RefSeq tracks of the respective genes (blue arrow denotes direction of transcription) and histone mark data tracks obtained after 12 cycles of sonication; scale for active marks H3K4me3 and H3K9ac is loge (ChIP/Input) [−5;5] and for repressive marks H3K27me3 and H3K9me3 loge (ChIP/Input) [−3;3]. Black and white arrowheads point to regions of loss and gain of histone marks in Tmpo KO, respectively.

