Figure 5.
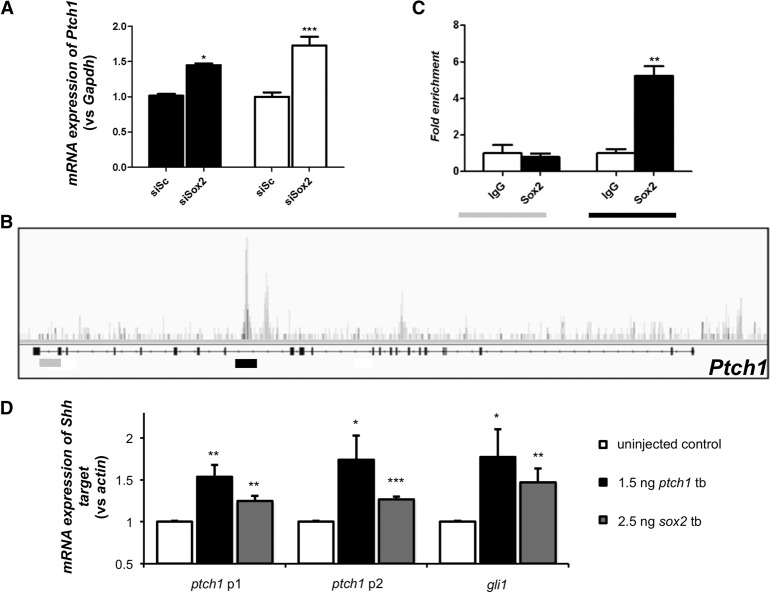
SOX2 regulates Ptch1 expression directly. (A) Targeted quantitative PCR after transfection of CCE-RX cells with a scrambled siRNA (siSc, n = 9) or a siRNA targeting Sox2 (siSox2, n = 9). This experiment showed that decreased expression of Sox2 leads to increased expression of Ptch1. (B) Results of ChIP-seq performed on CCE-RX cells using an antibody against SOX2. The Ptch1 gene structure is represented underneath the DNA fragments sequenced after ChIP, with higher peaks corresponding to more enrichment. A peak was identified in intron 15 of Ptch1 (underlined in black), while an example of an unenriched region is shown in intron 22 (underlined in gray). (C) Results obtained by ChIP-seq were confirmed using targeted ChIP-qPCR on five independent samples. Amplification of the intron 22 negative region (in gray) was equivalent whether using nonspecific IgG or a SOX2 antibody, while amplification of the intron 15 region (in black) showed greater than fivefold enrichment in chromatin immunoprecipitated by the SOX2-specific antibody. (A,C) Asterisks indicate statistical differences between the different conditions. (*) P < 0.05, (**) P < 0.01, (***) P < 0.001, Mann-Whitney U test. Error bars, SEM. (D) Quantitative (q)PCR of Shh targets ptch1 and gli1 after sox2 or ptch1 tb morpholino injection in zebrafish embryos from three biological replicates. p1 and p2 indicate primer sets targeting two different regions of ptch1. (*) P < 0.05, (**) P < 0.01, (***) P < 0.001, unpaired Student's t-test.

