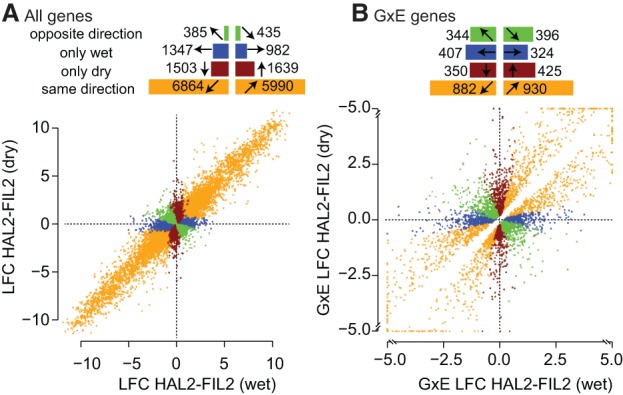
Figure 2.

Distribution of differential expression of total counts between HAL2 and FIL2 parents in drought and recovery treatments. Log2 fold changes (LFC) between HAL2 and FIL2 were calculated for all genes independently in each experimental treatment. (A) All genes with significant genotype effects are presented. (B) Only those genes with significant G×E effects are presented; those G×E genes with log2 fold changes greater than 5 or less than −5 are shrunk to 5 (−5) for plotting purposes. In each panel, genes were binned by the direction and significance of the LFC. The numbers of genes belonging to each bin are displayed as horizontal bar plots at the top of each panel.
