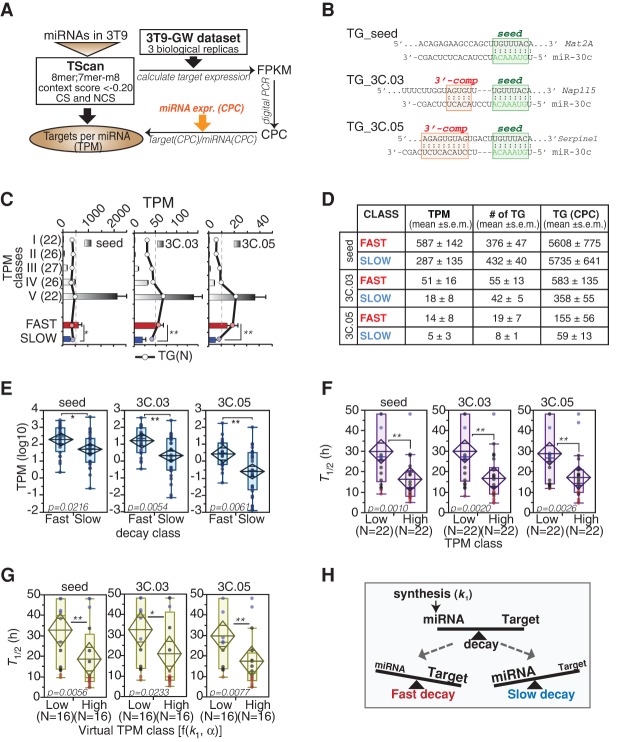
Figure 4.
miRNA targets and decay. (A,B) Scheme of strategy used for the target:miRNA ratio calculation. Targets of miRNAs were further distinguished according to their complementarity to the miRNA 3′ end. (TG_seed) Seed interaction; (TG_3C) seed plus 3′ compensatory site with moderate (3C.03) or extensive (3C.05) interaction. Examples are reported in panel B. (C,D) The bar graph (C) and the table (D) summarize the TPM, the number of targets [TG (N)], and their level of expression in “fast” versus “slow” miRNA classes. (*) P < 0.05; (**) P < 0.01; Wilcoxon test. (E) Box-plots show the distribution of the target:miRNA ratios (TPM, distinguished according to target complementarity as shown in B) in “fast” versus “slow” miRNAs. (F,G) miRNA half-life (T1/2) distribution within low (<20th Pctl) or high (>80th Pctl) TPM (F) or virtual TPM (G) miRNA classes. Virtual TPMs were calculated using transcription rate (k1) and cell doubling time (α) data. (H) The scheme summarizes the mutual relationship between targets, miRNA synthesis, miRNA expression levels and miRNA turnover rates. (E–G) P-values were calculated by Wilcoxon test.

