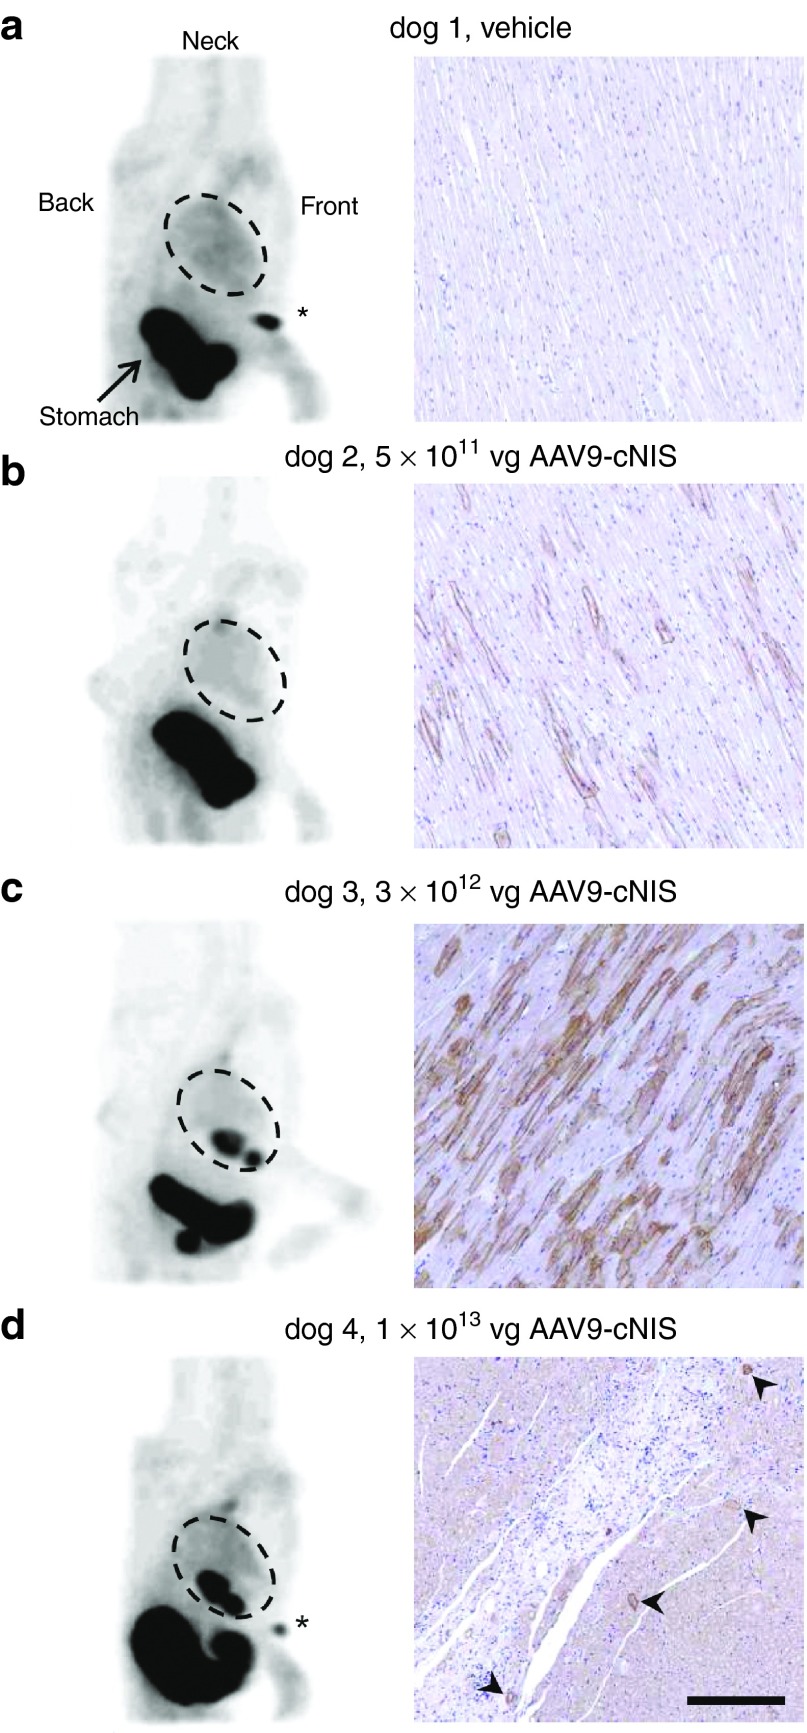
Figure 1.
NIS expression following epicardial vector administration. (a) Sham dog 1 injected with PBS. (b–d) Dogs 2–4 injected with increasing AAV9-cNIS doses. a–d Left panels present sagittal maximum intensity projection Tc-99m tomograms imaged 2 weeks after AAV9-cNIS injections. Gamma photon emission is displayed in shades of gray, on a gray scale from no (white) to maximum (black) Tc-99m uptake. Landmarks are noted in dog 1, and hearts are circled in all tomograms. When the Tc-99m injection site at the right forefoot appears it is indicated by an asterix. Right panels are representative immunohistochemistry (IHC) for cNIS (brown staining) in peri-injection LV samples harvested at necropsy after the final imaging. Arrow heads in d point at NIS positive cells. Nuclei are counterstained in blue. Bar = 200 μm (applies to all right pictures). AAV, adeno-associated virus; cNIS, canine sodium iodide symporter; IHC, immunohistochemistry.

