Figure 2.
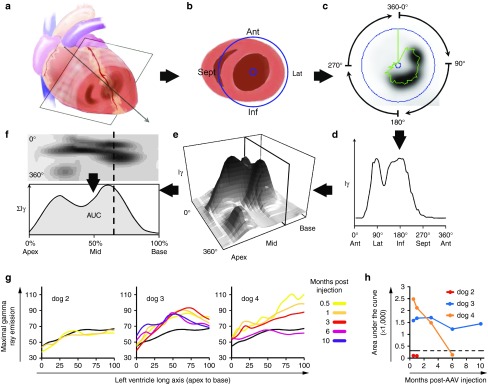
Quantitative SPECT analysis of global left ventricular cNIS transduction over time. (a) SPECT myocardial imaging data are reconstructed perpendicular to the left ventricular (LV) long axis to generate short axis (cartoon shown in (b)) views of isotope uptake (c) with black being most intense uptake. The LV space is defined (purple circles) and maximal gamma ray intensity (Iɣ) around the circumference of the short axis is collected every 6° (green trace) and plotted (d) for the entire short axis (0–360°). (e) The short axis tomogram profiles are compiled from base to apex into a 3D stack plot view or as flat representation in the top (f) picture, with Iɣ encoded in shades of gray. This enables appreciation of the location and the magnitude of the Tc-99m uptake throughout the whole LV. (f) Iɣ is integrated for every short axis slice (dashed line) from base to apex to obtain ƩIγ. The area under the ƩIɣ curve (AUC; subtracted for background blood uptake) is used as a global LV Tc-99m uptake measure at a specific imaging time. Images and data (c–f) shown are from the 3-week imaging in dog 12. (g) Quantitative analysis of the LV SPECT imaging from dogs injected endocardially with the C-Cath (ƩIɣ curves). The legend on the right defines the correspondence between curve colors and the imaging time postvector injection (in month). Each graph references results from PBS injected dog 1 imaged 2 weeks after the epicardial injection of PBS (black curve). (h) Global LV Tc-99m uptake is expressed as the AUC integrating Tc-99m uptake intensity over the long axis of the LV. The AUC obtained for control dog 1 is reported as a dash line threshold for comparison. cNIS, canine sodium iodide symporter; PBS, phosphate buffered saline; SPECT, single-photon emission computerized tomography.

