Figure 4.
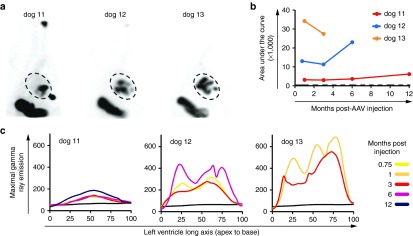
NIS SPECT imaging and quantification following endocardial vector administration. (a) Tc-99m tomograms performed 3–4 weeks following the C-Cath endocardial delivery of the vector. (b) Global LV Tc-99m uptake is expressed as the area under the integration curves presented in c. Control dog 1 threshold is reported as a dash line. (c) Quantitative gamma ray emission was plotted against the heart long axis displayed as percentage from apex (0%) to base (100%) as described in Figure 2a–f. A black curve corresponding to the signal of control dog 1 is reported in the three graphs. The color legend on the right defines the imaging times. NIS, sodium iodide symporter; SPECT, single-photon emission computerized tomography.

