Figure 4.
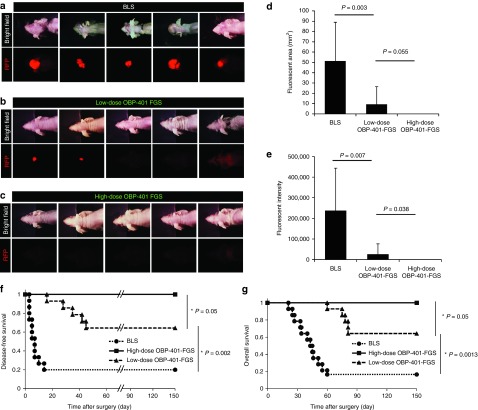
High-dose OBP-401–based FGS prevents local recurrence after surgery. (a) Representative whole-body images of five mice with orthotopic glioma 30–50 days after BLS. (b) Representative whole-body images of five mice with orthotopic glioma 70 days after low-dose OBP-401 FGS. (c) Representative whole-body images of orthotopic glioma 70 days after high-dose OBP-401 FGS. Bright-field (upper panels), RFP image (lower panels). (d) Comparison of fluorescent areas of recurrent tumors after BLS or low-dose OBP-401 FGS (BLS versus low-dose FGS; P = 0.003); or high-dose OBP-401 FGS (low-dose FGS versus high-dose FGS; P = 0.055). Fluorescent area is calculated with Image J software. (e) Comparison of fluorescence intensity of recurrent tumors after BLS or low-dose OBP-401 FGS (BLS versus low-dose FGS; P = 0.007) or high-dose OBP-401 FGS (low-dose FGS versus high-dose FGS; P = 0.038). Fluorescence intensity is calculated with Image J software. Data are shown as average ± SD. n = 14 (BLS); n = 14 (low-dose OBP-401-FGS); n = 9 (high-dose OBP-401-FGS). (f) Kaplan–Meier curve shows disease-free survival after BLS, low-dose OBP-401 FGS (BLS versus low-dose FGS; P = 0.002); or high-dose OBP-401 FGS (low-dose FGS versus high-dose FGS; P = 0.05). (g) Kaplan–Meier curve shows overall survival after BLS, low-dose OBP-401 FGS (BLS versus low-dose FGS; P = 0.0013); or high-dose OBP-401 FGS (low-dose FGS versus high-dose FGS; P = 0.05).

