Figure 3.
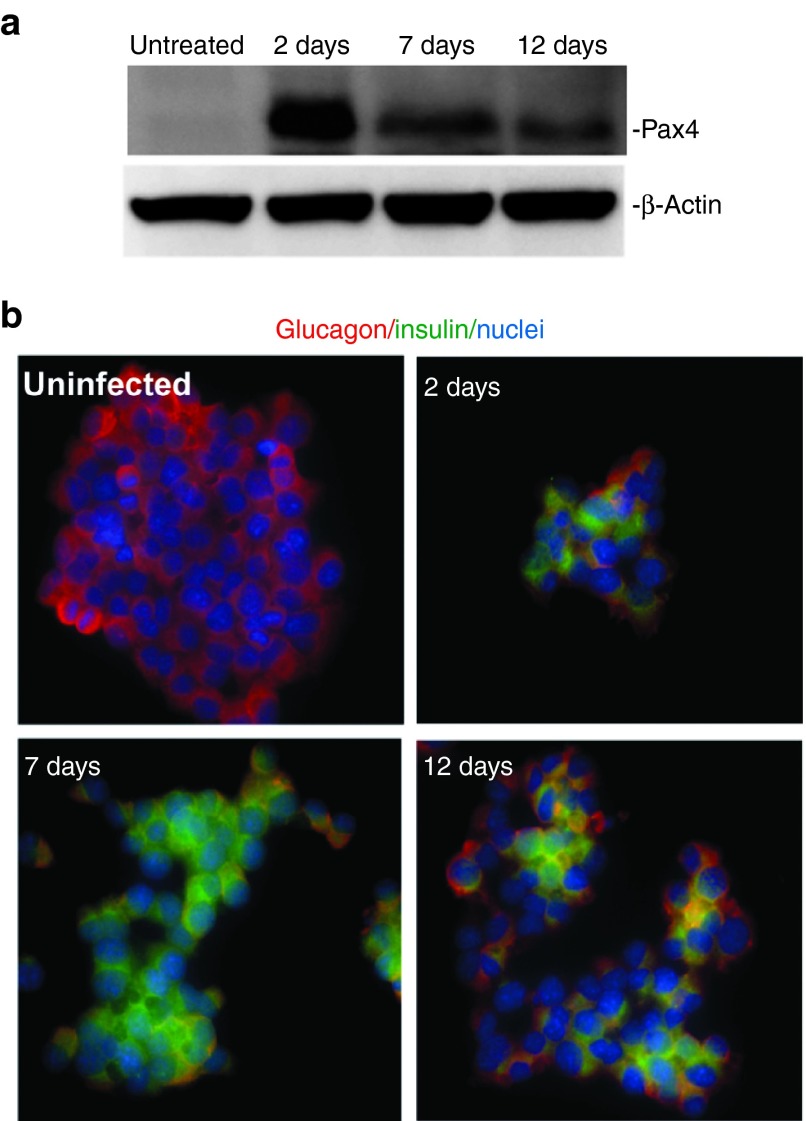
Insulin versus glucagon expression at various time points following Ad5.Pax4 treatment. The αTC1.9 cells plated in multiple dishes were infected with Ad5.Pax4 at MOI of 500 VPs/cell, and cells were either (a) lysed or (b) fixed at 2 days postinfection. In addition, some of the treated cells were passaged, cultured, and then collected as P1 (equivalent to 7 days) and P2 (equivalent to 12 days). (a) Western blotting assays showing Pax4 expression at various time points. β-Actin was used as the loading control. (b) Insulin (green) versus glucagon (red) expression at different time points following Ad5.Pax4 infection as assessed by immunofluorescence staining. Note the insulin signals increased from 2 to 7 days and declined at 12 days. MOI, multiplicity of infection.

