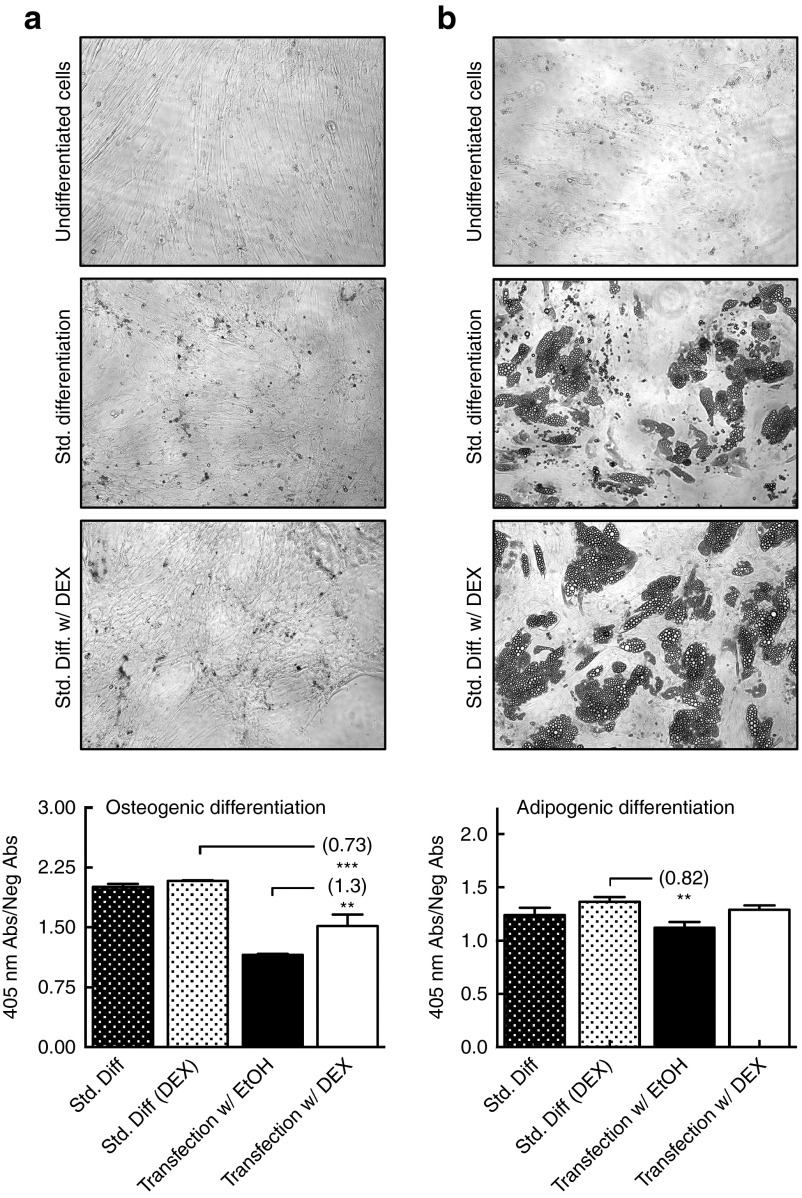
Figure 7.
Glucocorticoid (GC)-priming effect on human mesenchymal stem cell differentiation potential. All error bars represent the standard deviation of the mean for triplicate wells of differentiated cells. (a) Osteogenic differentiation images and spectrophotometric absorbance data of Alizarin Red staining, collected at 405 nm and normalized to the negative control. (b) Adipogenic differentiation images and spectrophotometric absorbance data of Oil Red O staining, collected at 540 nm and normalized to the negative control.

