Figure 7.
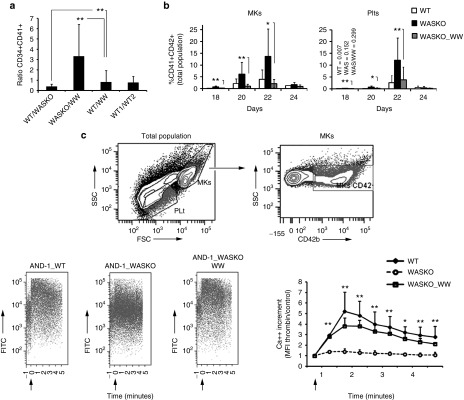
Ectopic expression of WAS on AND-1_WASKO cells restored normal MKs and Plts development and function. (a) Ectopic expression of WAS restores normal levels of CD34+CD41+ progenitors from hESCs-WASKO. The percentages of CD34+CD41+ were determined at day 15 of Megakaryocytic differentiation. The graph shows the ratio between the percentages of CD34+CD41+ cells derived from different hESCs as indicated at the bottom of each bar. Note that a ratio of 1 indicates no differences as observed in the WT/WW (ratio between WT and AND-1_WASKO_WW) and WT1/WT2 (ratio between WT1 and WT2) bars. Data are mean from at least five different experiments ± standard error of the mean. **P < 0.01. (b) Ectopic expression of WAS restores normal levels of MKs and Plts generated from hESCs-WASKO. Supernatant from OP9 cocultures from AND-1_WT, AND-1_WASKO, and AND-1_WASKO_WW were collected every 2 days from day 18 and the percentage of MKs (left graph) and Plts (right graph) determined as described in Figure 4. (c) Ectopic expression of WAS restores normal calcium responses to AND-1_WASKO_WW derived MKs. Calcium responses to thrombin (arrow) were evaluated in MKs derived from AND-1_WT, AND-1_WASKO, and AND-1_WASKO_WW. The upper plots shows the population considered as MKs. An example of the data generated for each cell line is shown in the bottom-left plots. A graph showing WASKO (open circles), WT (black diamonds) and WASKO_WW MKs (open squares) Ca++ responses along time is shown at the bottom-right corner. Data represent the increase in calcium levels after thrombin stimulation over the basal calcium levels, measured by the intensity of fluorescence of the calcium sensor dye. Thrombin addition (2 U/ml) is indicated by an arrow. Data represent mean ± SEM of at least three separate experiments using two AND-1_WT cell lines (AND-1_WT1 and AND-1_WT2), two AND-1_WASKO (AND-1_WASKO_c1.1 and AND-1_WASKO c1.2) and two AND-1_WASKO_WW (AND-1_WASKO_WW.1 and AND-1_WASKO_WW.2. *P < 0.05; **P < 0.01.

