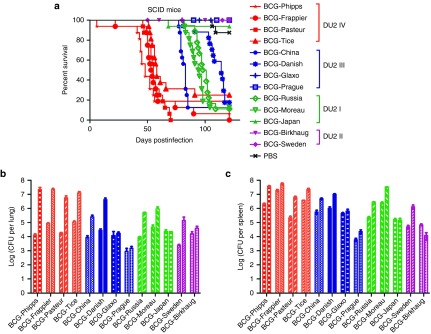
Figure 1.
Differential virulence of BCG strains in SCID mice. (a) Survival curves of SCID mice infected with 13 different BCG strains. The survival curves were plotted using the Kaplan–Meier method and differences between curves were analyzed using the log-rank test. BCG strains belonging to the same DU2 groups are highlighted in the same color. (b,c) CFUs in the lungs (b) and spleen (c) of SCID mice at 1 and 4 weeks after infection with 13 different BCG strains. The first bar of each strain is the data from week 1 and the second bar is the data from week 4. Data were plotted as mean ± SD (n = 4). BCG, Bacille Calmette–Guérin; CFU, colony-forming unit; PBS, phosphate-buffered saline.

