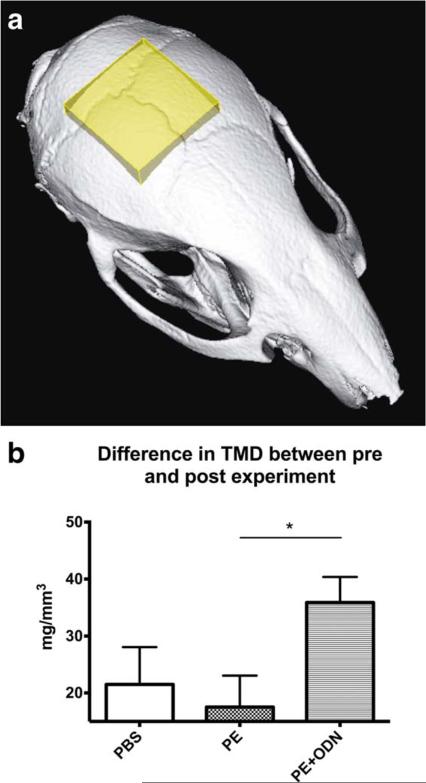
FIGURE 1.
Micro-CT analysis. The tissue mineral density (TMD) was analyzed in the three groups; injection of PBS, PE particles or PE particles + NF-κB decoy ODN (PBS, PE, and PE + ODN groups) in order to evaluate the effect of NF-κB decoy ODN on PE particle induced inflammation and osteolysis. (a) The volume of interest was defined as a 5 × 5 × 2 mm cuboid which has an anterior limit located at the beginning of the sagittal suture. (b) Bar diagram showing the TMD in the three groups during the 14-day experiment. ** p < 0.01. [Color figure can be viewed in the online issue, which is available at wileyonlinelibrary.com.]

