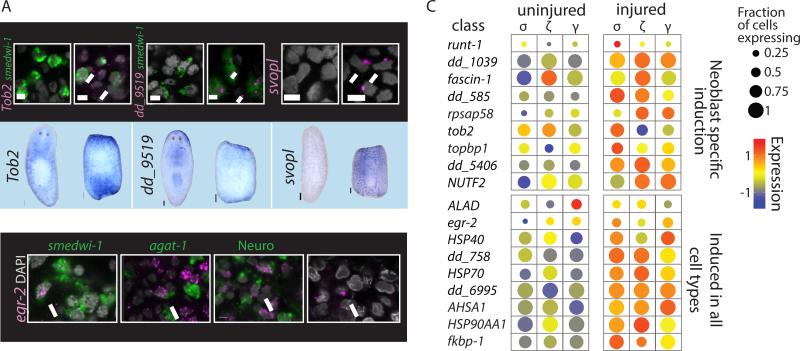
Figure 3. Analysis of Cell-Type-Specific Expression After Injury.
(A) Validations of tissue-specific wound-induced genes. Upper panel: dFISH analysis (scale = 5μm) of cell-type-specific wound-induced gene (magenta) and a cell-type marker (green), or imaging of the outermost layer (epidermis). Nuclei labeled with DAPI (gray). White arrows point to co-expressing cells. Lower panel: WISH analysis comparing gene expression in intact and amputated animals (scale = 100μm). (B) dFISH analysis of egr-2 (magenta) with markers of multiple tissues in animals 12 hpi (green; smedwi-1 – neoblasts; agat-1 – epidermal progenitors; Neuro (pooled RNA probes for PC2, synapsin, synaptotagmin) – Neural tissue; epidermal cells were imaged by the outermost layer of the animals). WISH/FISH analysis was done on at least 15 fragments for each gene. (C) Gene expression comparison of uninjured and injured neoblasts. Shown are dot plots of neoblast-specific wound-induced genes (top panel) and genes found to be wound-induced in most or all cell types (bottom panel) in the different neoblast classes. Dot size represents the fraction of expressing cells (0-1); color represents the expression levels (z-score) in the fraction of expressing cells.

