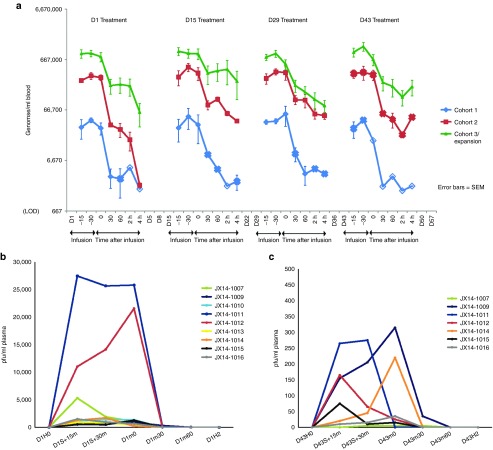
Figure 2.
Pexa-Vec pharmacokinetics following multiple IV infusions. (a) Quantitative polymerase chain reaction detection of Pexa-Vec genomes in blood after cycles 1–4. Mean genomes/ml were calculated after removing individual patient values that were below the limit of detection (LOD). The solid marker indicates that the mean value at a time point is based on three samples for Cohorts 1 and 2 and nine samples (D1 and D15), eight samples (D29), or seven samples (D43) for Cohort 3. The “x” marker indicates that there were only two samples above the LOD used to calculate the mean value. The unfilled marker indicates that the value of the time point is based on only one sample above the LOD. (b) Pexa-Vec pfu detection in plasma after cycle 1. (c) Pexa-Vec pfu detection in plasma after cycle 4.

