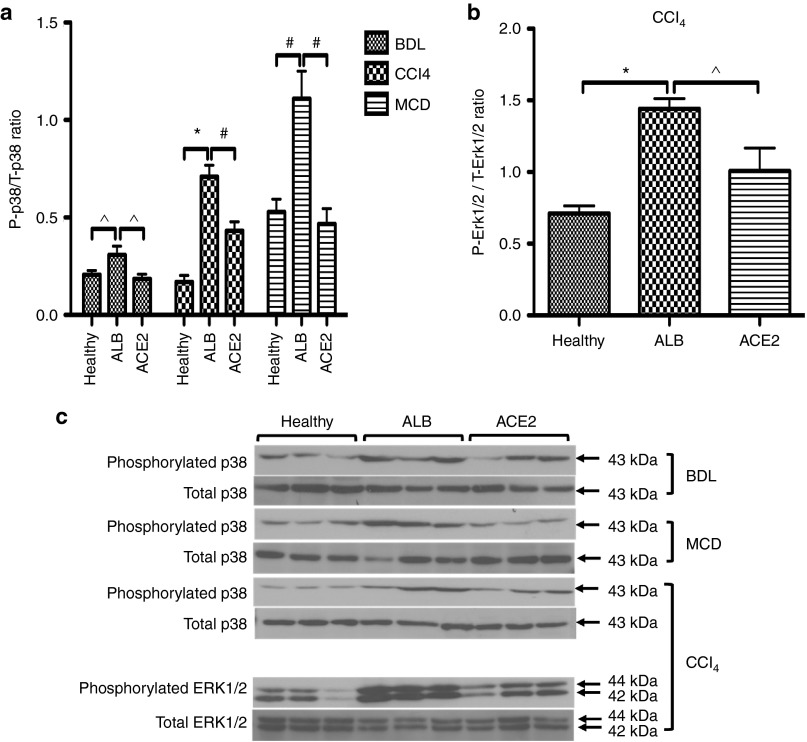
Figure 7.
ACE2 reduced phosphorylation of MAPKs including (a and c) p38 in the BDL, MCD, and CCl4 models and (b and c) ERK1/2 in the CCl4 model. Phosphorylation of MAPKs was evaluated by western blotting in total liver proteins. Each bar represents the mean ± SEM profile from n > 10 mice per treatment group. *P < 0.0001, #P < 0.01, and ^P < 0.05 were calculated by one-way analysis of variance (ANOVA) with Tukey comparison test.

