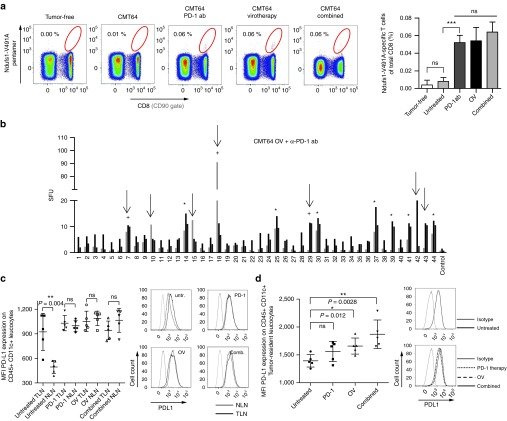
Figure 4.
PD-1 inhibition during virus-mediated tumor inflammation broadens the epitope spectrum of neoantigenome-directed CD8 T-cell responses. (a) Using Ndufs1-V491A-specific pentamers for direct T-cell receptor staining, tumor-directed CD8 T-cell responses were monitored in mice after PD-1 checkpoint inhibition, oncolytic virotherapy, and a combination of both treatments. Tumor-free mice and untreated CMT64-tumor bearing mice served as controls. The gating in the representative dotplots (left panel) refers to Ndufs1-V491A-specific CD8 T-cells and the corresponding quantitative analysis is shown on the right panel. (b) Mice bearing s.c. CMT64-tumors received a combination of PD-1 checkpoint blockade (d0 and d3) and oncolytic virotherapy (n = 8). 7 days following virotherapy, mice were screened for neoantigenome-specific CD8 T-cell responses. Epitopes induced by virotherapy are marked by asterisks. Additionally detected T-cell responses, which were neither induced by PD-1 blockade nor by virotherapy alone, are indicated by arrows. Additional epitopes, which were observable in at least 50% of responding individuals are marked by a plus sign. (c) For each treatment group, CD45+ CD11c+ leukocytes were prepared from tumor-draining lymphnodes (TLN) and nontumor-draining lymphnodes (NLN) and PD-L1 expression was quantified by flow cytometry. For those cells derived from corresponding treatment groups, mean fluorescence intensity of PD-L1 is indicated in the graph on the left side. The right panel shows representative histograms. (d) Accordingly, tumor-resident CD45+ CD11c+ leukocytes were prepared from CMT64 tumor-tissue and PD-L1 expression was analyzed.

