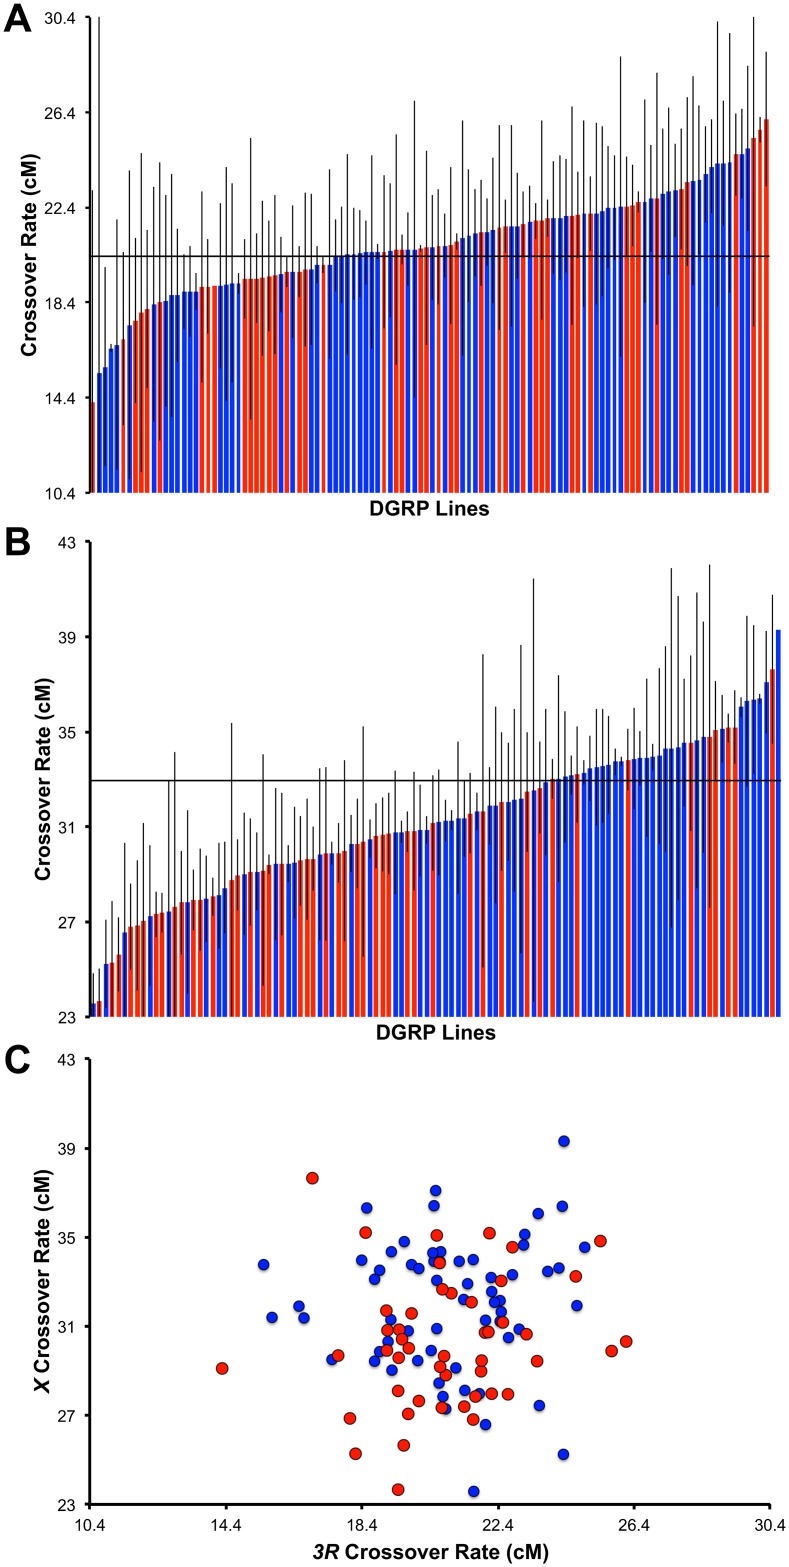
Fig 2. Natural variation in recombination rate.
Variation in crossover frequency in the DGRP (standard karyotypes only) in the (A) e ro interval on chromosome 3R and (B) in the y v interval on the X chromosome. The strains in each panel are ordered by recombination rate. DGRP lines infected by Wolbachia are indicated in blue while DGRP lines not infected by Wolbachia are indicated in red. Grey bars depict standard error. For reference, the reported map distance for the e ro interval is 20.4 cM, while the reported map distance for the y v interval is 33 cM, indicated by a horizontal line in both graphs. (C) Recombination rate on 3R as a function of recombination rate on the X chromosome (standard karyotypes only).

