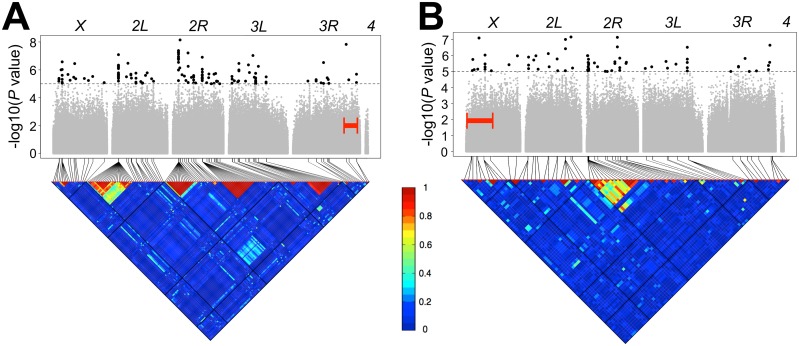
Fig 3. Genome-wide association analyses.
Manhattan plots and accompanying linkage disequilibrium heat maps are depicted for the (A) e ro interval and (B) y v interval for lines with standard karyotypes. A significance threshold of P ≤10−5 is denoted for Manhattan plots. Each point is a tested genetic variant in the DGRP and points above this threshold (in black and enlarged to aid in visualization) indicate significantly associating variants. Additionally, the surveyed interval for each chromosome (either e ro or y v) is bracketed in red. The triangular heat map displays the amount of linkage disequilibrium (LD, measured here as r2) between variants. Each major chromosome is depicted. Red denotes complete LD and blue denotes absence of LD.

