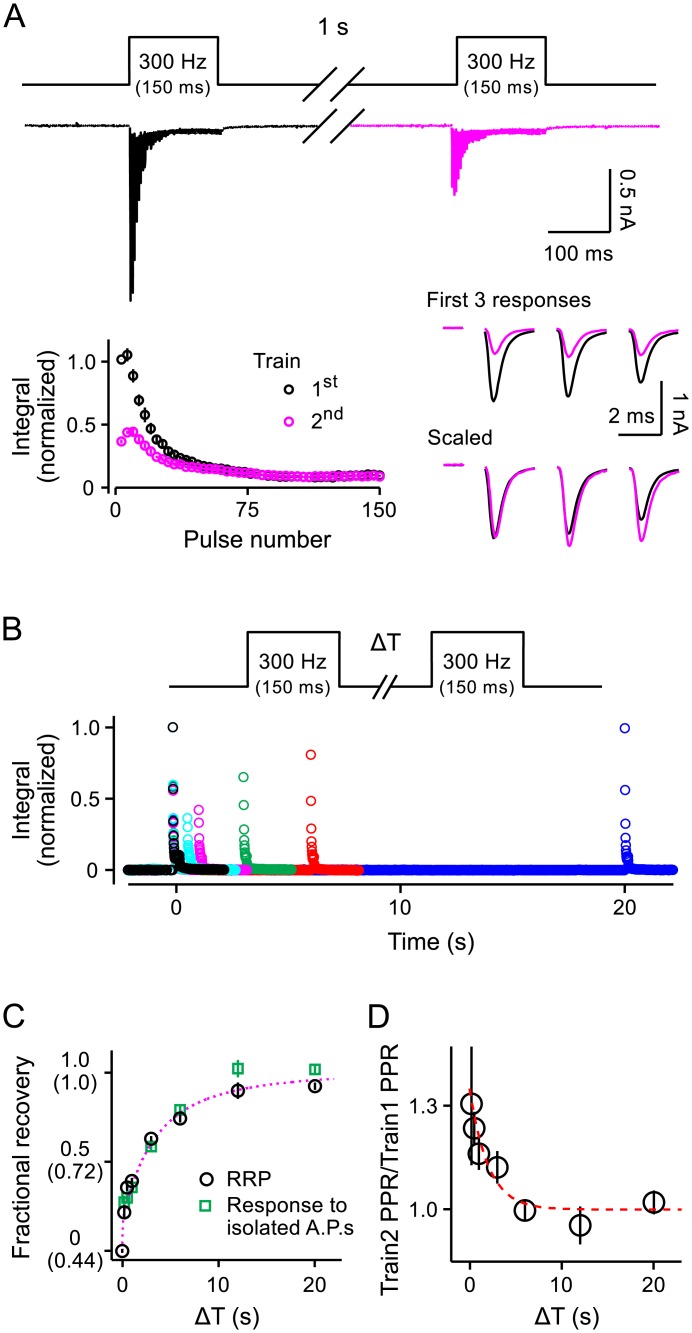
Fig 8. Recovery from depression during rest intervals.
A. Incomplete RRP replenishment in 1s. Stimulation was pairs of 150ms-long trains at 300Hz separated by 1s rest intervals as diagrammed at top. Top trace: Averaged raw data across all experiments after blanking stimulation artifacts; trace is colored magenta during the second train to match the panels below. Bottom left: Quantification; responses were divided into 3.33ms segments, integrated, normalized by the value for the first segment, and averaged across trials (black is first train, magenta is second). Bottom right: Overlaid traces from the first 10ms of each train illustrate slightly more paired-pulse facilitation during the second train. B. Integrated segments (10ms) for a series of experiments with a range of inter-train intervals. Data are from a single preparation; multiple traces for each inter-train interval were averaged digitally before segmentation and integration. C. Time course of recovery from depression (n ≥ 14 trials from 7 preparations). Circles (black) are the integral of the entire second train divided by the integral of the first train. Squares (green) are the integral of the first 3.33ms segment of the second train divided by the first segment of the first train. The Y-axis is calibrated so that recovery was 0 when the inter-train interval was 0. The values in parentheses are uncorrected integral of the second train divided by the integral of the first; the value for inter-train intervals of 0 was 0.44, even though the RRP was empty, because of ongoing release of newly recruited neurotransmitter during stimulation. The dashed line (magenta) is Eq 3 in the Results. D. Time course of decay of the small enhancement in the paired-pulse ratio caused by prior stimulation. The dashed line is the single exponential where τ = 2s.

