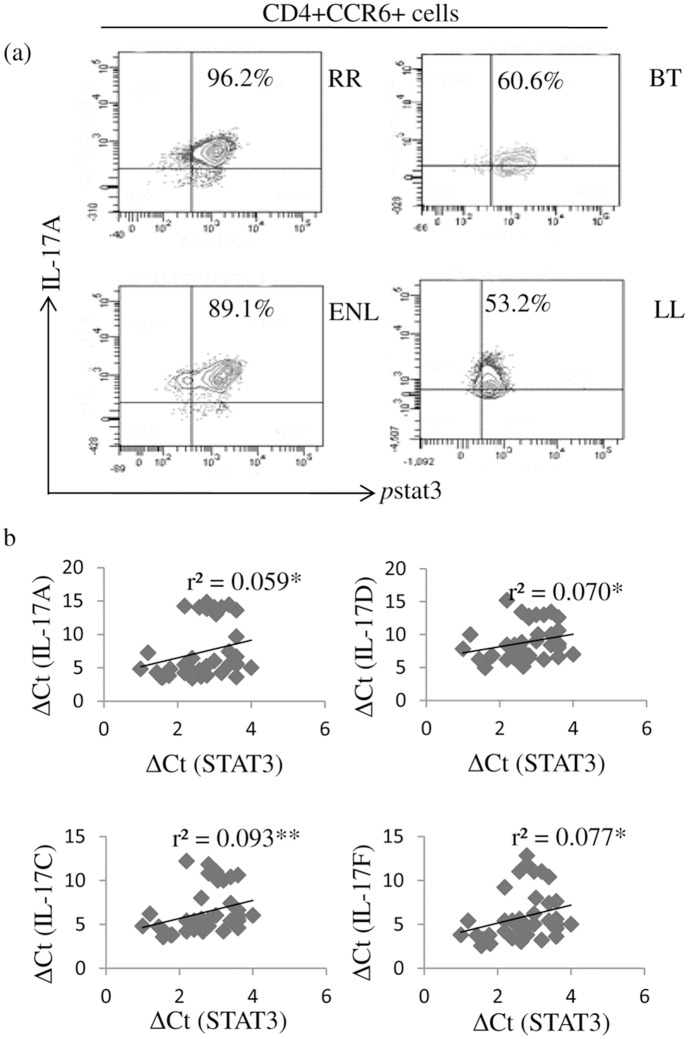
Fig 4. Increase in pSTAT3+IL17+ cells in leprosy reactions patients.
Flow cytometry analysis of antigen stimulated 48 h culture of PBMC shows increase in pSTAT3 bearing CCR6+ cells with intracellular IL-17A in both RR and ENL subjects as compared to matching stable leprosy (a) Representative dot plots from each of RR, BT and ENL, LL leprosy patients (see Materials and Methods). (b) Scatter plots of combined qPCR data from both reaction patients RR and ENL, showing significant positive correlation of STAT3 expression (ΔCT) with IL17A, IL17D, IL17C and IL17F. Correlation coefficient (r2) was calculated by Spearman non-parametric correlation test, p< 0.05 was considered statistically significant. p<0.01 = *, p<0.001 = **, Abbreviations as in Fig 1.

