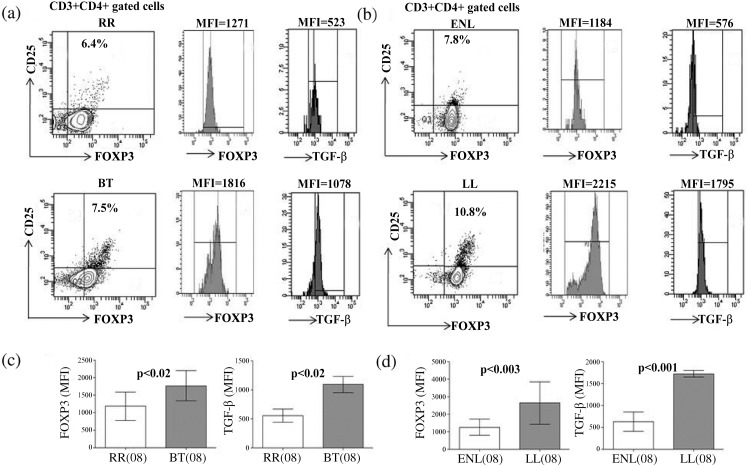
Fig 5. Reduction of FOXP3 and TGF-β in T cells of leprosy reaction patients.
Flowcytometry analysis demonstrates reduction in percentage of CD3+CD4+gated CD25+FOXP3+ cells (see Materials and Methods). Dot plots show percentage of CD25+FOXP3+ cells in representative patients with RR, ENL as compared to stable BT, LL patients respectively. Histogram shows MFI (mean florescent intensity) of nuclear FOXP3 and intracellular TGF-β in each of RR and ENL as compared to respective BT and LL (Figs a, b). Bar diagram shows MFI of nuclear FOXP3 and TGF-β (mean±SD) in RR, ENL as compared to BT, LL leprosy groups respectively (Figs b, c). Data were analyzed using two tailed Mann-Whitney, p< 0.05 was considered as statistically significant. (), Parenthesis shows number of subjects tested. Abbreviations as Fig 1.

