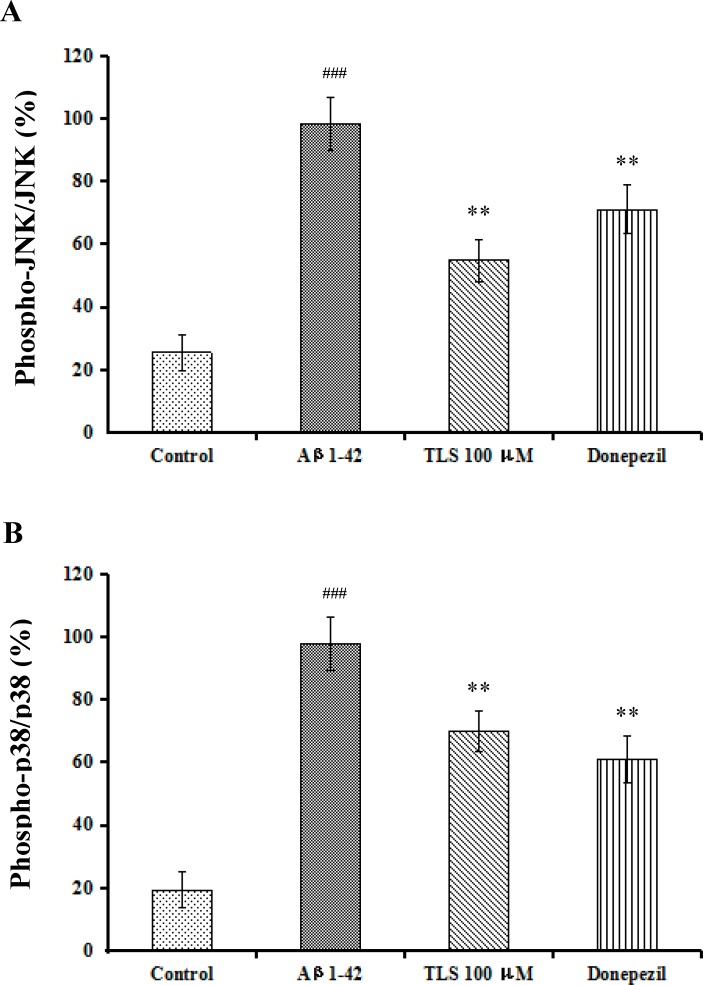
Fig 12. Effects of TLS on the expressions of JNK and p38 in Aβ1-42-induced primary mouse neuronal cells.
The expression of JNK (A), p38 (B). Values indicated mean ± S.E.M. and were analyzed by ANOVA followed by Tukey's multiple comparison test (n = 6). #p < 0.05, ##p < 0.01 compared with the control group, ###p < 0.001 compared with the sham group; *p < 0.05, **p < 0.01 compared with the Aβ1–42 group.

