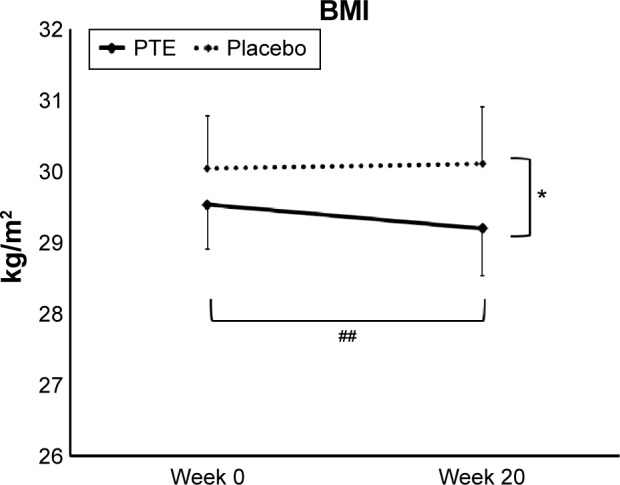
Figure 2.

Body mass index (BMI).
Notes: Shown as the group averages ± standard error of mean for the Puer tea extract (PTE) group (solid lines) and the placebo group (dashed lines). There was a significant difference in BMI between the two groups at week 20. The BMI reduction within the PTE group over the course of the 20-week study was highly significant. *P<0.05, ##P<0.01.
