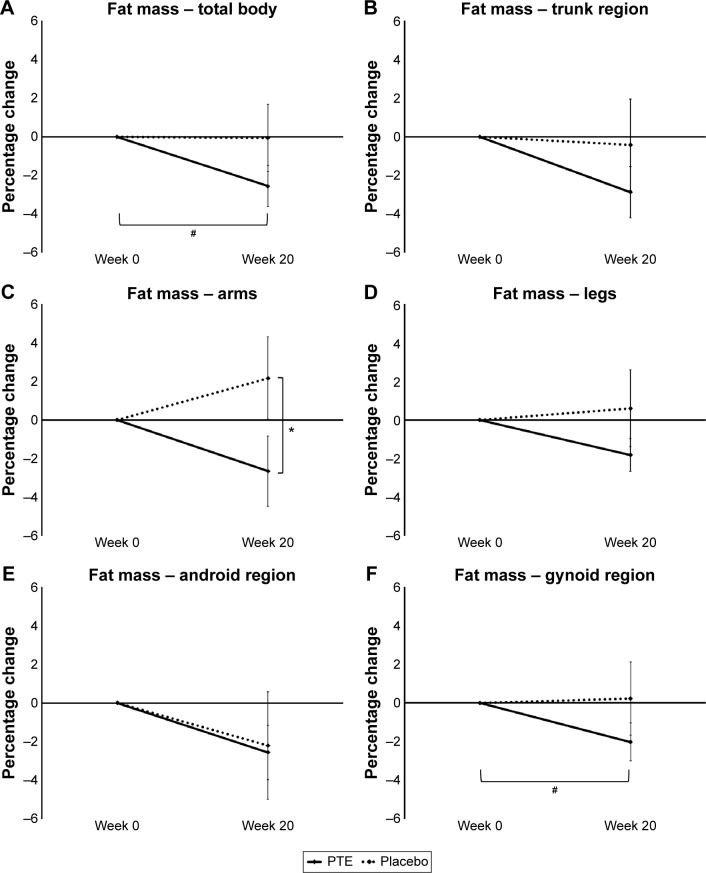
Figure 3.
Changes in total body fat and regional fat composition.
Notes: Shown as the group averages of the individual percentage changes ± standard error of mean for the Puer tea extract (PTE) group (solid lines) and the placebo group (dashed lines). There were no significant differences between the two groups at week 20; however, the between-group difference in fat loss in the arms showed a statistical trend. Within the group consuming PTE, a significant loss of total body fat was seen. The total fat loss was associated with regional fat loss in the trunk, arms, thighs, and gynoid (belly/hip) regions. The fat loss in the gynoid region within the PTE group was statistically significant. *P<0.1, #P<0.05.

