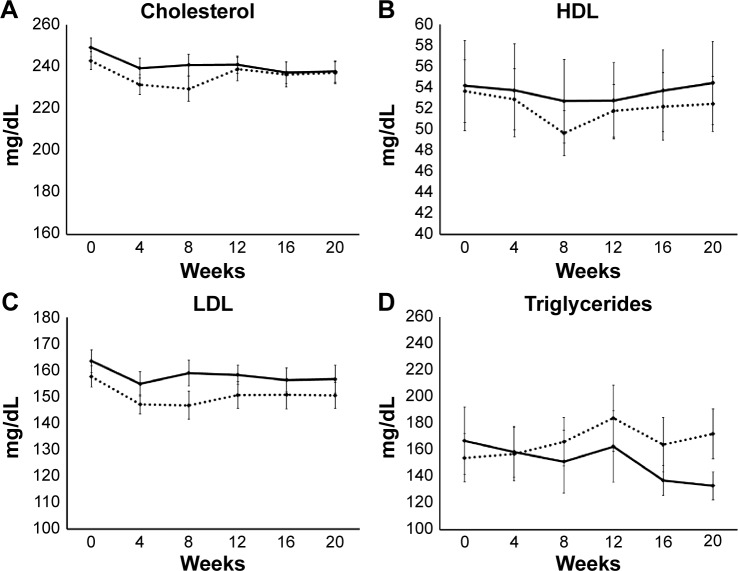
Figure 4.
Lipid data are shown as group averages ± standard error of mean for the Puer tea extract (PTE) group (solid lines) and the placebo group (dashed lines).
Notes: There were no significant differences between the PTE and placebo results for cholesterol (A), HDL (B), or LDL (C). Within the PTE group, a significant reduction in cholesterol levels was seen already at week 4, and remained statistically significantly lower than baseline throughout the study. Triglyceride levels showed a reduction in the PTE group that was not statistically significant, but was clinically important (D): the group average in the PTE group went down into the normal range (below 150 mg/dL) after 8 weeks, and remained low throughout the remainder of the study. After 20 weeks, there was a 20% reduction in the average triglyceride levels within the PTE group (P<0.08).
Abbreviations: HDL, high-density lipoprotein; LDL, low-density lipoprotein.

