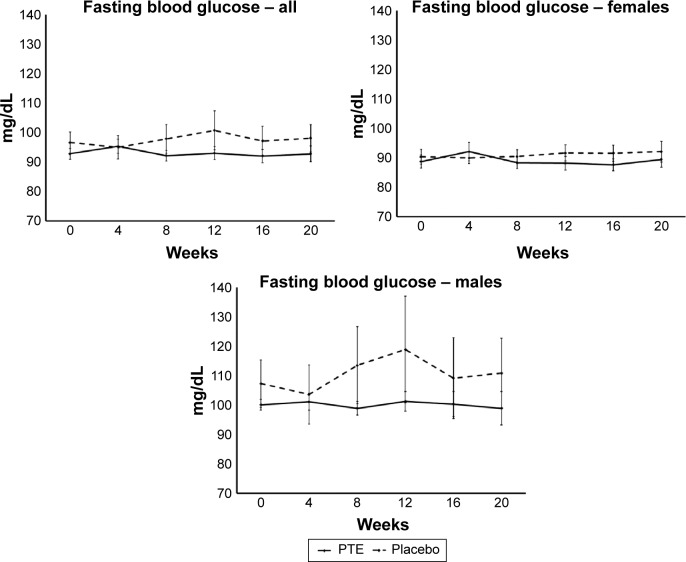
Figure 5.
Fasting blood glucose levels.
Notes: Shown as group averages ± standard error of mean for the Puer tea extract (PTE) group (solid lines) and the placebo group (dashed lines). There were no significant differences between the PTE and placebo results during the study; however, the fasting blood glucose levels remained lower in the PTE group than the placebo group from week 8 throughout the remainder of the 20-week study.

