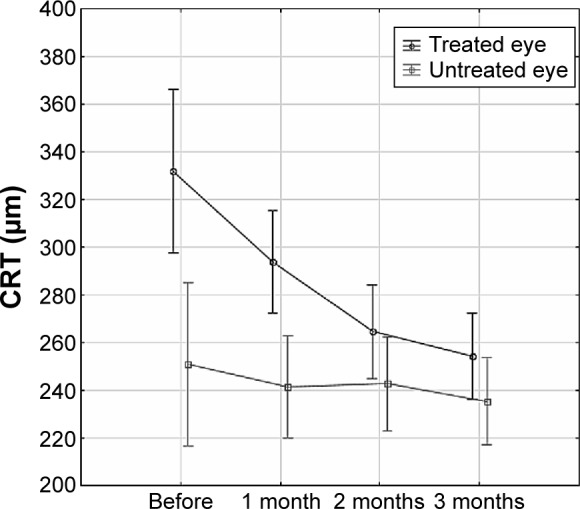
Figure 1.

The differences in central retinal thickness (CRT) over time in treated and untreated contralateral eyes.
Note: Data presented as mean with 95% CI, P<0.05, ANOVA for repeated measures.
Abbreviations: CI, confidence interval; ANOVA, analysis of variance.
