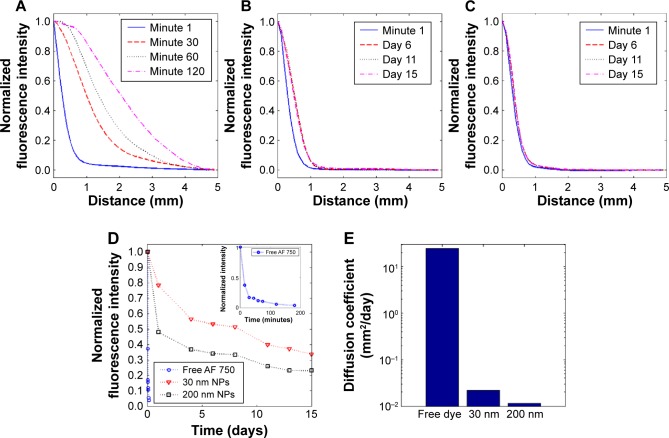
Figure 4.
Diffusion (fluorescence) as a function of distance from the phantom center, averaged over all phantoms imaged (N=3) and normalized to the intensity at x=0 for each time point.
Notes: Data for (A) free AF 750 dye, (B) 30 nm nanoparticles, and (C) 200 nm nanoparticles are shown. (D) Average maximum fluorescence intensity normalized to initial time point per phantom type showing the continual decrease in maximum fluorescence over time. Inset time scale of free AF 750 dye diffusion is on the order of minutes compared to days in part (D). (E) Diffusion coefficients found by fitting the diffusion profile curves to on a logarithmic scale.
Abbreviations: AF, Alexa Fluor; NPs, nanoparticles.

